Berlin: Fire Incidents, Wisconsin (WI)
Where are fire incidents reported in Berlin, WI
Something went wrong! Please refresh the page.
|
| |||||||||||||||||||||||||||||||||||||||||||||||||||||||||||||||||||||||||||||||||||||||||||||||||||||||||||||
2002 - 2018 National Fire Incident Reporting System (NFIRS) incidents
- Incident types reported to NFIRS in Berlin, WI
- 40035.4%Fire
- 21719.2%Rescue & EMS
- 17715.6%Hazardous Condition
- 16414.5%False Alarm
- 1059.3%Good Intent Call
- 605.3%Service Call
- 50.4%Severe Weather
- 20.2%Overpressure Rupture
- Fire incident types reported to NFIRS in Berlin, WI
- 14335.8%Structure Fires
- 11328.3%Outside Fires
- 8220.5%Other
- 6215.5%Mobile Property/Vehicle Fires
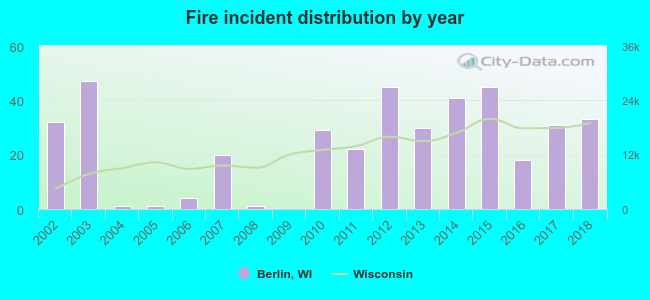 Based on the data from the years 2002 - 2018 the average number of fires per year is 24. The highest number of reported fire incidents - 47 took place in 2003, and the least - 0 in 2009. The data has a rising trend.
The average number of yearly fire incidents per 10k residents in Berlin, WI compared to nearest cities:
(Note: Based on data for the last 3 years, including only cities with population 5,000 and above)
| Berlin: | 50.3 |
| Ripon: | 49.3 |
| Oshkosh: | 18.1 |
| Waupun: | 33.4 |
| North Fond du Lac: | 20.6 |
| Waupaca: | 81.4 |
| Neenah: | 32.4 |
| Fond du Lac: | 34.1 |
| Greenville: | 20.4 |

 34.8% incidents where reported in the morning and 65.3% in the evening. The most fires (18.0%) took place on Sunday, and the least (10.0%) on Thursday.
 According to the 400 fire incident reports from years 2002 - 2018 most fires (13.0%) took place during April, and the least (4.5%) in September.
 Out of all 1,131 cases reported during the years 2002 - 2018, the most belonged to the categories: Fire (35.4%), Rescue & EMS (19.2%), and Hazardous Condition (15.6%).
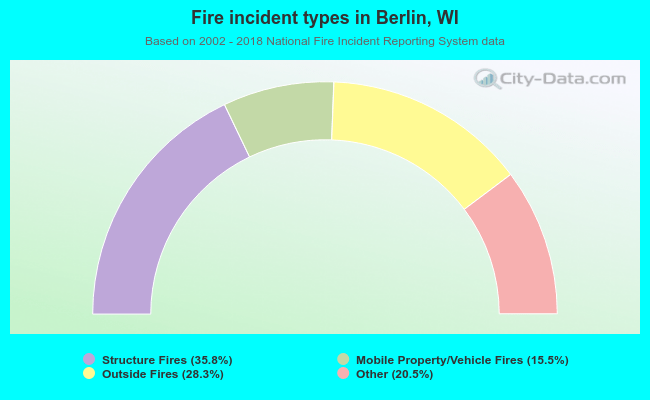 When looking into fire subcategories, the most reports belonged to: Structure Fires (35.8%), and Outside Fires (28.3%).