Ripon: Fire Incidents, Wisconsin (WI)
Where are fire incidents reported in Ripon, WI
Something went wrong! Please refresh the page.
|
| |||||||||||||||||||||||||||||||||||||||||||||||||||||||||||||||||||||||||||||||||||||||||||||||||||||||||||||
2002 - 2018 National Fire Incident Reporting System (NFIRS) incidents
- Incident types reported to NFIRS in Ripon, WI
- 36929.3%Fire
- 28822.8%False Alarm
- 26020.6%Hazardous Condition
- 15512.3%Rescue & EMS
- 957.5%Good Intent Call
- 574.5%Service Call
- 282.2%Severe Weather
- 80.6%Special Incident
- Fire incident types reported to NFIRS in Ripon, WI
- 24265.6%Structure Fires
- 8422.8%Outside Fires
- 287.6%Mobile Property/Vehicle Fires
- 154.1%Other
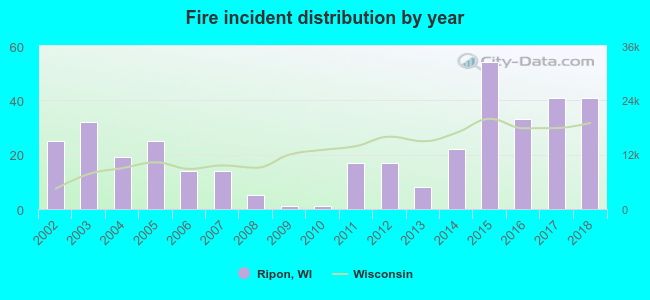 According to the data from the years 2002 - 2018 the average number of fires per year is 22. The highest number of fire incidents - 54 took place in 2015, and the least - 1 in 2009. The data has an increasing trend.
The average number of yearly fire incidents per 10k residents in Ripon, WI compared to nearest cities:
(Note: Based on data for the last 3 years, including only cities with population 5,000 and above)
| Ripon: | 49.3 |
| Berlin: | 50.3 |
| Waupun: | 33.4 |
| North Fond du Lac: | 20.6 |
| Oshkosh: | 18.1 |
| Fond du Lac: | 34.1 |
| Beaver Dam: | 47.6 |
| Mayville: | 64.6 |
| Neenah: | 32.4 |

 31.7% incidents where reported in the morning and 68.3% in the evening. The most fires (19.0%) took place on Monday, and the least (9.5%) on Tuesday.
 Based on the 369 fire incident reports from years 2002 - 2018 most fires (11.1%) took place during April, and the least (4.3%) in February.
 Out of all 1,261 cases reported during the years 2002 - 2018, the most belonged to the categories: Fire (29.3%), False Alarm (22.8%), and Hazardous Condition (20.6%).
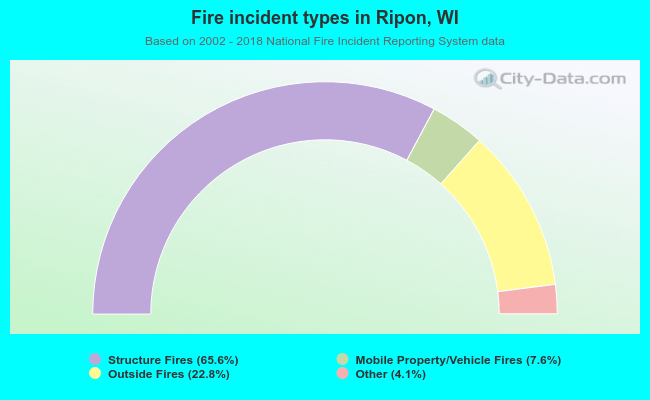 When looking into fire subcategories, the most incidents belonged to: Structure Fires (65.6%), and Outside Fires (22.8%).