Bernville: Fire Incidents, Pennsylvania (PA)
Where are fire incidents reported in Bernville, PA
Something went wrong! Please refresh the page.
|
| |||||||||||||||||||||||||||||||||||||||||||||||||||||||||||||||||||||||||||||||||||||||||||||||||||||||||||||
| Other | 167 | |||||||||||||||||||||||||||||||||||||||||||||||||||||||||||||||||||||||||||||||||||||||||||||||||||||||||||||
2003 - 2018 National Fire Incident Reporting System (NFIRS) incidents
- Incident types reported to NFIRS in Bernville, PA
- 1,08733.8%Rescue & EMS
- 1,05332.7%Fire
- 35611.1%Hazardous Condition
- 32610.1%Good Intent Call
- 2287.1%Service Call
- 1123.5%False Alarm
- 290.9%Special Incident
- 220.7%Severe Weather
- 60.2%Overpressure Rupture
- Fire incident types reported to NFIRS in Bernville, PA
- 45843.5%Structure Fires
- 34933.1%Other
- 14413.7%Outside Fires
- 1029.7%Mobile Property/Vehicle Fires
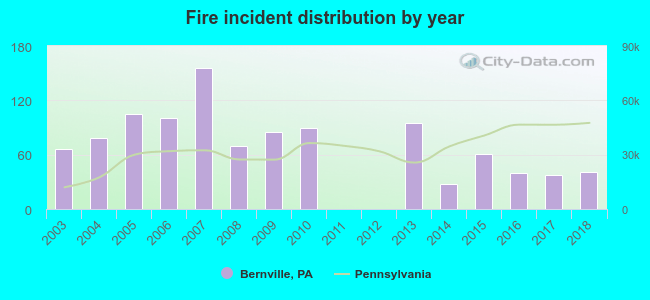 According to the data from the years 2003 - 2018 the average number of fire incidents per year is 66. The highest number of fires - 156 took place in 2007, and the least - 0 in 2011. The data has a declining trend.
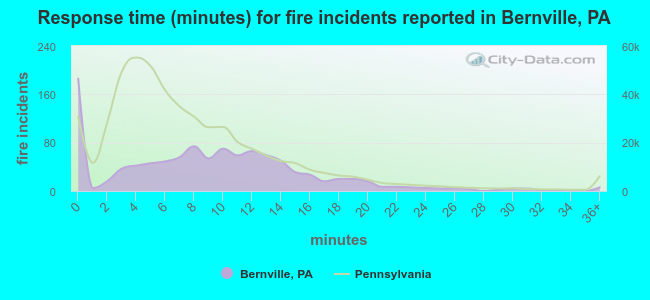 The median response time based on all reported fire incidents is 9 minutes. This is higher than the Pennsylvania median value.
The median response time in Bernville, PA compared to nearest cities:
(Note: Based on data for all years, including only cities with at least 500 fire incidents)
| Bernville: | 9 minutes |
| Leesport: | 10 minutes |
| Sinking Spring: | 6 minutes |
| Wyomissing: | 6 minutes |
| Hamburg: | 11 minutes |
| Myerstown: | 3 minutes |
| Reading: | 3 minutes |
| Mohnton: | 9 minutes |
| Denver: | 9 minutes |
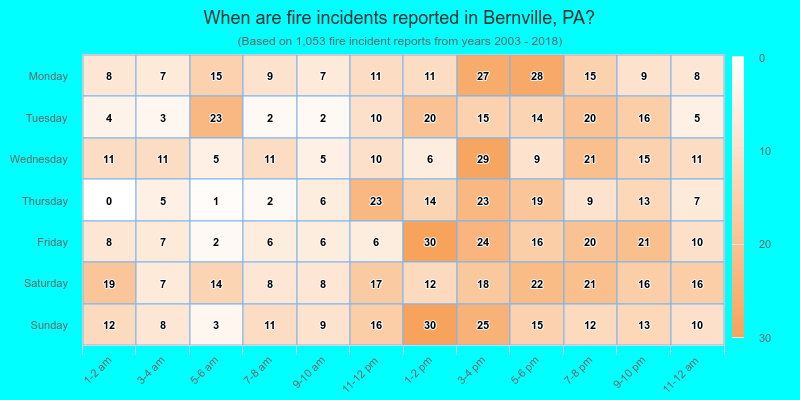
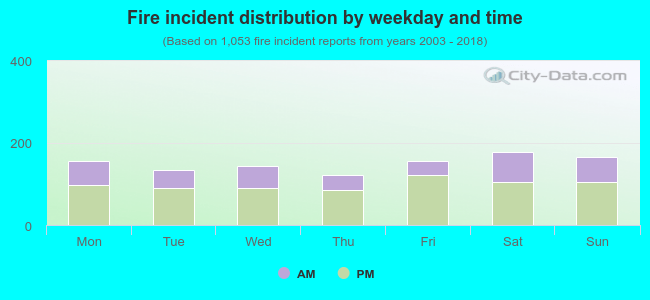 34.0% incidents where reported in the morning and 66.0% in the evening. The most fires (16.9%) took place on Saturday, and the least (11.6%) on Thursday.
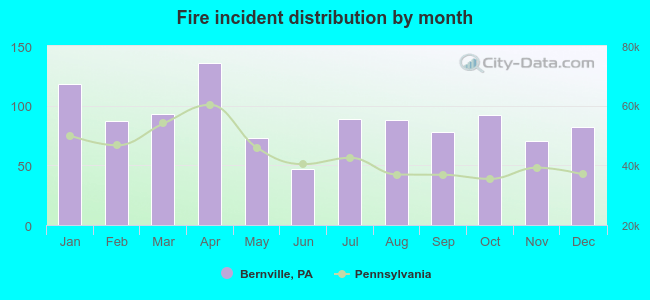 Based on the 1,053 fire incident reports from years 2003 - 2018 most fires (12.9%) took place during April, and the least (4.5%) in June.
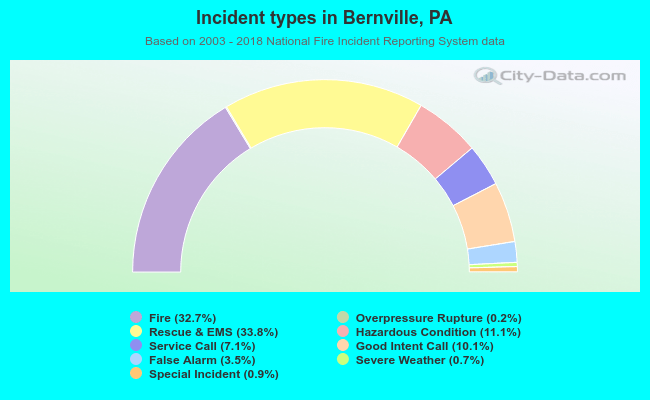 Out of all 3,219 cases reported during the years 2003 - 2018, the most belonged to the categories: Rescue & EMS (33.8%), Fire (32.7%), and Hazardous Condition (11.1%).
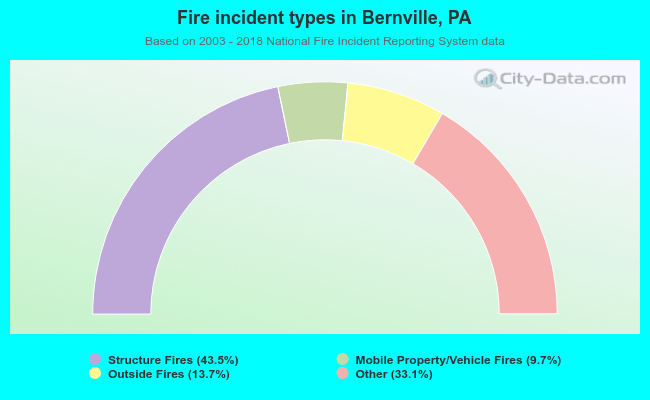 When looking into fire subcategories, the most incidents belonged to: Structure Fires (43.5%), and Other (33.1%).