Reading: Fire Incidents, Pennsylvania (PA)
Where are fire incidents reported in Reading, PA
Something went wrong! Please refresh the page.
| Fire incidents reported | |
|---|---|
| Sreet name | Count |
| FRANKLIN ST | 858 |
| 10TH ST | 458 |
| 4TH ST | 396 |
| 9TH ST | 346 |
| FRONT ST | 330 |
| 5TH ST | 312 |
| SUMMIT AVE | 302 |
| 6TH ST | 288 |
| COURT ST | 266 |
| 11TH ST | 264 |
| PERKIOMEN AVE | 224 |
| 4 ST | 214 |
| PENN ST | 176 |
| 10 ST | 172 |
| MOSS ST | 164 |
| LANCASTER AVE | 162 |
| OLEY ST | 156 |
| SCHUYLKILL AVE | 150 |
| 12TH ST | 148 |
| GREENWICH ST | 140 |
| PERKIOMEN AV | 138 |
| BUTTONWOOD ST | 126 |
| 13TH ST | 124 |
| 3RD ST | 124 |
| 8TH ST | 124 |
| WALNUT ST | 124 |
| 2ND ST | 118 |
| DOUGLASS ST | 118 |
| WASHINGTON ST | 118 |
| MULBERRY ST | 110 |
| Other | 1,638 |
2003 - 2018 National Fire Incident Reporting System (NFIRS) incidents
- Incident types reported to NFIRS in Reading, PA
- 12,54235.0%Rescue & EMS
- 8,38823.4%Fire
- 6,54918.3%Hazardous Condition
- 3,81610.7%Good Intent Call
- 3,0518.5%False Alarm
- 1,2763.6%Service Call
- 1450.4%Special Incident
- 370.1%Overpressure Rupture
- Fire incident types reported to NFIRS in Reading, PA
- 5,26062.7%Structure Fires
- 1,63819.5%Outside Fires
- 94711.3%Mobile Property/Vehicle Fires
- 5436.5%Other
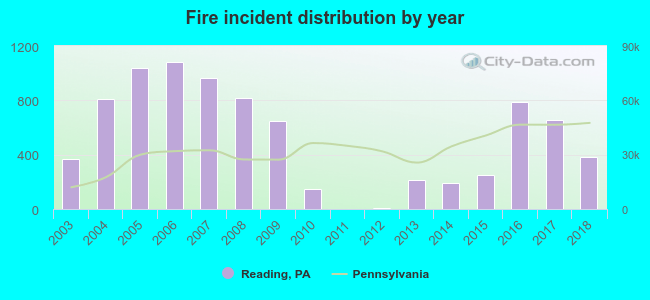 According to the data from the years 2003 - 2018 the average number of fires per year is 523. The highest number of reported fires - 1,082 took place in 2006, and the least - 1 in 2011. The data has an increasing trend.
The average number of yearly fire incidents per 10k residents in Reading, PA compared to nearest cities:
(Note: Based on data for the last 3 years, including only cities with population 5,000 and above)
| Reading: | 69.4 |
| Wyomissing: | 48.1 |
| Shillington: | 50.7 |
| Blandon: | 4.9 |
| Birdsboro: | 87.4 |
| Kutztown: | 94.4 |
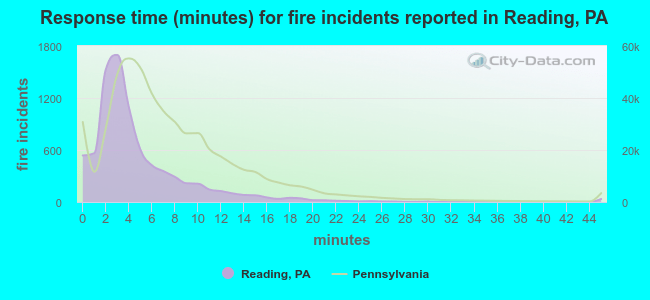 The median response time based on all reported fire incidents is 3 minutes. This is much lower than the state median value.
The median response time in Reading, PA compared to nearest cities:
(Note: Based on data for all years, including only cities with at least 500 fire incidents)
| Reading: | 3 minutes |
| Wyomissing: | 6 minutes |
| Mohnton: | 9 minutes |
| Sinking Spring: | 6 minutes |
| Leesport: | 10 minutes |
| Birdsboro: | 9 minutes |
| Fleetwood: | 8 minutes |
| Bernville: | 9 minutes |
| Douglassville: | 8 minutes |
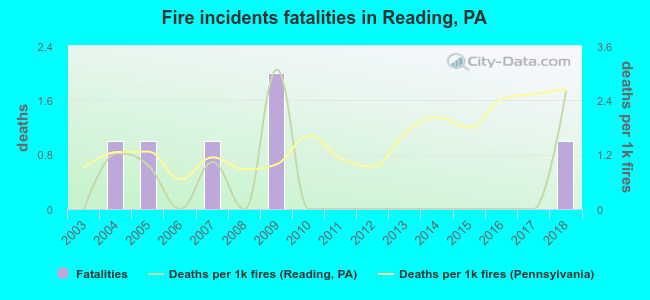 According to the reports from the years 2003 - 2018 the average number of fire-related yearly deaths is 0. The highest number of deaths - 2 took place in 2009, and the lowest - 0 in 2003. The data has a rising trend.
The average number of fatalities per 1,000 fire incidents is 1. This indicator was the highest - 3 in 2009, and the lowest 0 in 2003. The trend for deaths per 1,000 fires is increasing. Compared to the state value the number of fatalities per 1,000 fire incidents is much lower.
According to the reports from the years 2003 - 2018 the average number of fire-related yearly deaths is 0. The highest number of deaths - 2 took place in 2009, and the lowest - 0 in 2003. The data has a rising trend.
The average number of fatalities per 1,000 fire incidents is 1. This indicator was the highest - 3 in 2009, and the lowest 0 in 2003. The trend for deaths per 1,000 fires is increasing. Compared to the state value the number of fatalities per 1,000 fire incidents is much lower.Deaths per 1,000 incidents in Reading, PA compared to nearest cities:
(Note: Based on data for all years, including only cities with at least 2,500 fire incidents)
| Reading: | 0.7 |
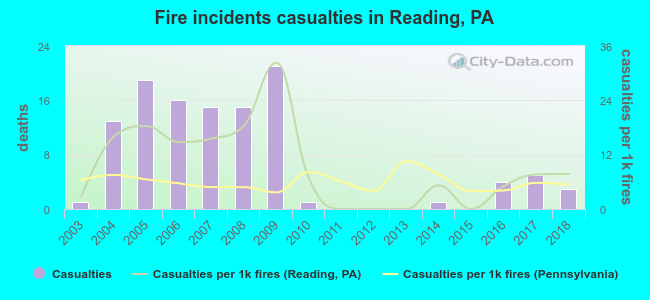 Based on the reports from the years 2003 - 2018 the average number of fire-related casualties per year is 7. The highest number of reported casualties - 21 took place in 2009, and the lowest - 0 in 2011. The data has an increasing trend.
The average number of injuries per 1,000 fire incidents is 9. This indicator was the highest - 32 in 2009, and the lowest 0 in 2011. The trend for casualties per 1,000 fire incidents is growing. Compared to the state value the number of casualties per 1,000 fires is much higher.
Based on the reports from the years 2003 - 2018 the average number of fire-related casualties per year is 7. The highest number of reported casualties - 21 took place in 2009, and the lowest - 0 in 2011. The data has an increasing trend.
The average number of injuries per 1,000 fire incidents is 9. This indicator was the highest - 32 in 2009, and the lowest 0 in 2011. The trend for casualties per 1,000 fire incidents is growing. Compared to the state value the number of casualties per 1,000 fires is much higher.Casualties per 1,000 incidents in Reading, PA compared to nearest cities:
(Note: Based on data for all years, including only cities with at least 500 fire incidents)
| Reading: | 13.6 |
| Wyomissing: | 6.4 |
| Mohnton: | 2.8 |
| Sinking Spring: | 2.9 |
| Leesport: | 1.7 |
| Birdsboro: | 0.0 |
| Fleetwood: | 1.0 |
| Bernville: | 0.0 |
| Douglassville: | 0.0 |
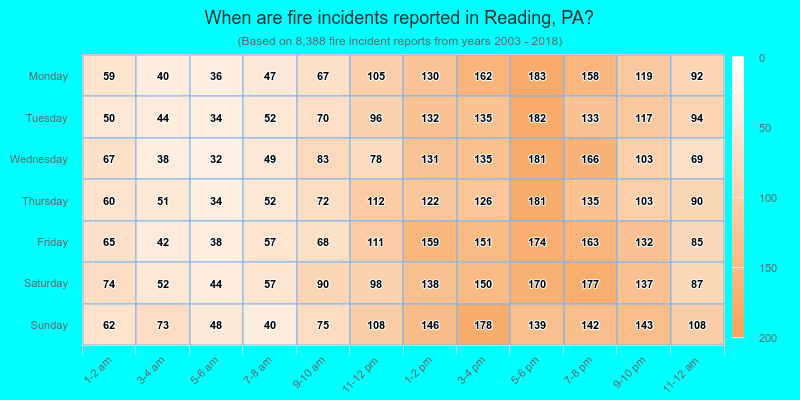
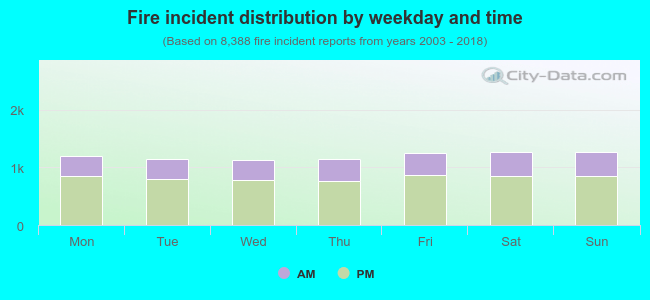 31.4% incidents where reported in the morning and 68.6% in the evening. The most fires (15.2%) took place on Saturday, and the least (13.5%) on Wednesday.
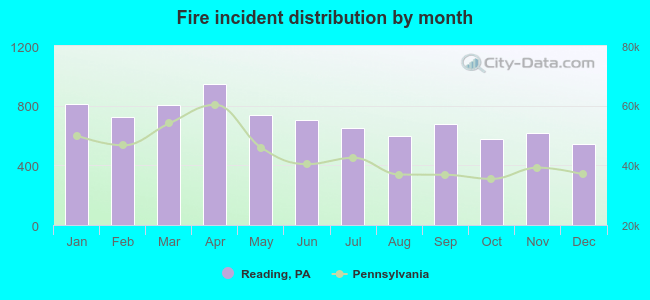 According to the 8,388 fire incident reports from years 2003 - 2018 most fires (11.3%) took place during April, and the least (6.4%) in December.
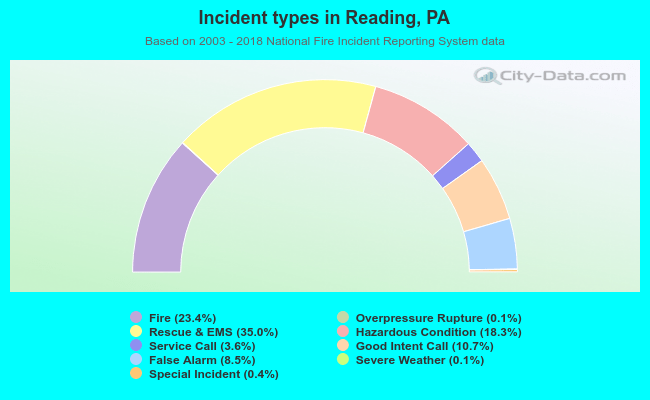 Out of all 35,828 cases reported during the years 2003 - 2018, the most belonged to the categories: Rescue & EMS (35.0%), Fire (23.4%), and Hazardous Condition (18.3%).
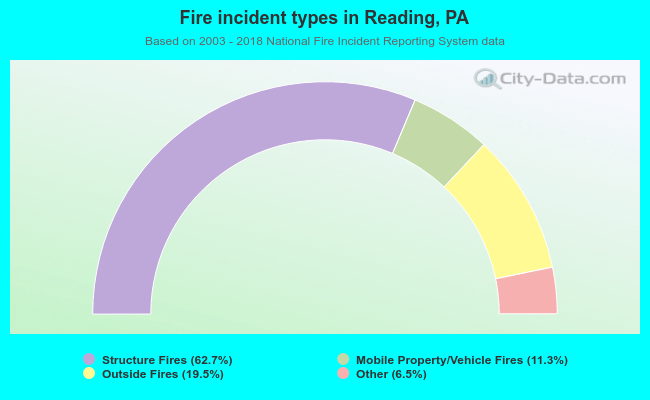 When looking into fire subcategories, the most reports belonged to: Structure Fires (62.7%), and Outside Fires (19.5%).