Boston: Fire Incidents, Massachusetts (MA)
Where are fire incidents reported in Boston, MA
Something went wrong! Please refresh the page.
| Fire incidents reported | |
|---|---|
| Sreet name | Count |
| WASHINGTON ST | 4,656 |
| COMMONWEALTH AV | 3,356 |
| TREMONT ST | 2,494 |
| HUNTINGTON AV | 2,346 |
| CENTRE ST | 2,330 |
| BEACON ST | 2,260 |
| BOYLSTON ST | 2,080 |
| PARK DR | 1,530 |
| COLUMBIA RD | 1,516 |
| MASSACHUSETTS AV | 1,500 |
| RIVER ST | 1,462 |
| BLUE HILL AV | 1,330 |
| COMMONWEALTH AVE | 1,310 |
| DORCHESTER AV | 1,222 |
| CAMBRIDGE ST | 1,022 |
| DUDLEY ST | 978 |
| WARREN ST | 918 |
| MORTON ST | 896 |
| HUNTINGTON AVE | 878 |
| NEWTON ST | 808 |
| BORDER ST | 776 |
| HARRISON AV | 762 |
| HYDE PARK AV | 748 |
| MASSACHUSETTS AVE | 728 |
| COLUMBUS AV | 710 |
| SUMMER ST | 696 |
| BLUE HILL AVE | 694 |
| ADAMS ST | 674 |
| NORTHAMPTON ST | 658 |
| SOUTH ST | 658 |
| Other | 39,562 |
2003 - 2018 National Fire Incident Reporting System (NFIRS) incidents
- Incident types reported to NFIRS in Boston, MA
- 181,95135.2%Rescue & EMS
- 81,55815.8%Fire
- 76,50514.8%False Alarm
- 67,22313.0%Hazardous Condition
- 58,18711.3%Service Call
- 44,9438.7%Good Intent Call
- 5,4341.1%Special Incident
- Fire incident types reported to NFIRS in Boston, MA
- 56,28869.0%Structure Fires
- 18,21822.3%Outside Fires
- 5,7247.0%Mobile Property/Vehicle Fires
- 1,3281.6%Other
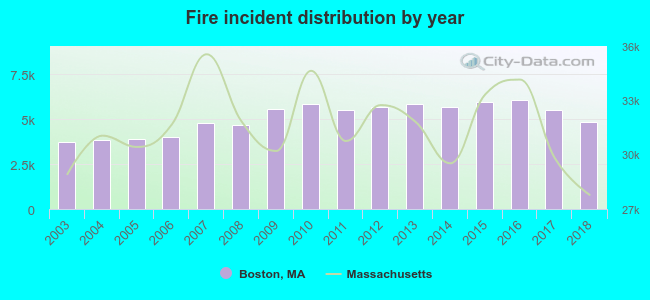 According to the data from the years 2003 - 2018 the average number of fires per year is 5,097. The highest number of reported fire incidents - 6,058 took place in 2016, and the least - 3,714 in 2003. The data has a rising trend.
The average number of yearly fire incidents per 10k residents in Boston, MA compared to nearest cities:
(Note: Based on data for the last 3 years, including only cities with population 5,000 and above)
| Boston: | 83.7 |
| Brookline: | 72.0 |
| Cambridge: | 99.2 |
| Milton: | 54.6 |
| Somerville: | 56.2 |
| Watertown: | 12.2 |
| Chelsea: | 76.9 |
| Quincy: | 60.7 |
| Newton: | 29.6 |
 The median response time based on all reported fire incidents is 3 minutes. This is lower than the state median value.
The median response time in Boston, MA compared to nearest cities:
(Note: Based on data for all years, including only cities with at least 500 fire incidents)
| Boston: | 3 minutes |
| Brookline: | 3 minutes |
| Cambridge: | 5 minutes |
| Milton: | 3 minutes |
| Somerville: | 3 minutes |
| Watertown: | 4 minutes |
| Chelsea: | 3 minutes |
| Quincy: | 3 minutes |
| Newton: | 5 minutes |
 Based on the reports from the years 2003 - 2018 the average number of fire-related yearly deaths is 3. The highest number of deaths - 9 took place in 2007, and the lowest - 0 in 2009. The data has a dropping trend.
The average number of fatalities per 1,000 fire incidents is 1. This indicator was the highest - 2 in 2007, and the lowest 0 in 2009. The trend for deaths per 1,000 fires is decreasing. Compared to the Massachusetts value the number of deaths per 1,000 fires is much lower.
Based on the reports from the years 2003 - 2018 the average number of fire-related yearly deaths is 3. The highest number of deaths - 9 took place in 2007, and the lowest - 0 in 2009. The data has a dropping trend.
The average number of fatalities per 1,000 fire incidents is 1. This indicator was the highest - 2 in 2007, and the lowest 0 in 2009. The trend for deaths per 1,000 fires is decreasing. Compared to the Massachusetts value the number of deaths per 1,000 fires is much lower.
 Based on the data from the years 2003 - 2018 the average number of fire-related casualties per year is 18. The highest number of reported casualties - 51 took place in 2003, and the lowest - 1 in 2015. The data has a dropping trend.
The average number of injuries per 1,000 fire incidents is 4. This indicator was the highest - 14 in 2003, and the lowest 0 in 2015. The trend for casualties per 1,000 fires is decreasing. Compared to the Massachusetts value the number of casualties per 1,000 fire incidents is much lower.
Based on the data from the years 2003 - 2018 the average number of fire-related casualties per year is 18. The highest number of reported casualties - 51 took place in 2003, and the lowest - 1 in 2015. The data has a dropping trend.
The average number of injuries per 1,000 fire incidents is 4. This indicator was the highest - 14 in 2003, and the lowest 0 in 2015. The trend for casualties per 1,000 fires is decreasing. Compared to the Massachusetts value the number of casualties per 1,000 fire incidents is much lower.
 31.4% incidents where reported in the morning and 68.6% in the evening. The most fires (15.8%) took place on Sunday, and the least (13.4%) on Tuesday.
 Based on the 81,558 fire incident reports from years 2003 - 2018 most fires (9.3%) took place during May, and the least (7.3%) in August.
 Out of all 516,209 cases reported during the years 2003 - 2018, the most belonged to the categories: Rescue & EMS (35.2%), Fire (15.8%), and False Alarm (14.8%).
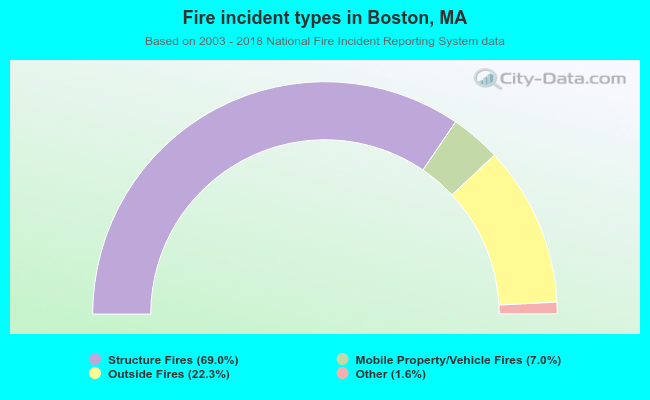 When looking into fire subcategories, the most reports belonged to: Structure Fires (69.0%), and Outside Fires (22.3%).