Brookline: Fire Incidents, Massachusetts (MA)
Where are fire incidents reported in Brookline, MA
Something went wrong! Please refresh the page.
| Fire incidents reported | |
|---|---|
| Sreet name | Count |
| BEACON ST | 1,240 |
| HARVARD ST | 342 |
| WASHINGTON ST | 302 |
| PEARL ST | 270 |
| CENTRE ST | 264 |
| ST PAUL ST | 264 |
| HIGH ST | 252 |
| EGMONT ST | 238 |
| PARK ST | 198 |
| BOYLSTON ST | 194 |
| PLEASANT ST | 194 |
| KENT ST | 166 |
| FREEMAN ST | 158 |
| BABCOCK ST | 136 |
| MARION ST | 104 |
| HEATH ST | 92 |
| WEBSTER ST | 86 |
| WINCHESTER ST | 86 |
| CHESTNUT ST | 82 |
| FULLER ST | 80 |
| TAPPAN ST | 76 |
| WINTHROP RD | 66 |
| CLINTON RD | 62 |
| HAMMOND ST | 62 |
| POND AV | 62 |
| STEARNS RD | 60 |
| CYPRESS ST | 58 |
| LONGWOOD AV | 56 |
| POND | 56 |
| CARLTON ST | 54 |
2002 - 2018 National Fire Incident Reporting System (NFIRS) incidents
- Incident types reported to NFIRS in Brookline, MA
- 15,83446.5%Rescue & EMS
- 5,11215.0%False Alarm
- 4,46213.1%Hazardous Condition
- 4,42813.0%Fire
- 2,9668.7%Service Call
- 1,1303.3%Good Intent Call
- 490.1%Special Incident
- 380.1%Overpressure Rupture
- Fire incident types reported to NFIRS in Brookline, MA
- 3,83786.7%Structure Fires
- 4149.3%Outside Fires
- 1353.0%Mobile Property/Vehicle Fires
- 420.9%Other
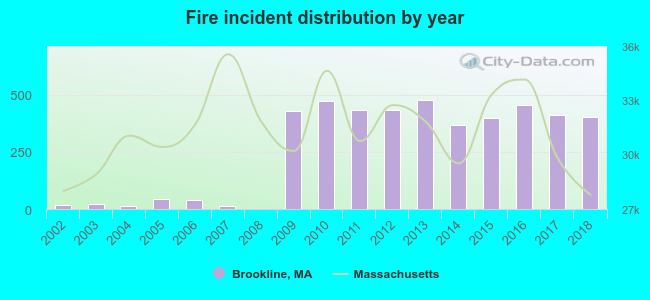 According to the data from the years 2002 - 2018 the average number of fire incidents per year is 260. The highest number of reported fires - 476 took place in 2013, and the least - 0 in 2008. The data has a growing trend.
The average number of yearly fire incidents per 10k residents in Brookline, MA compared to nearest cities:
(Note: Based on data for the last 3 years, including only cities with population 5,000 and above)
| Brookline: | 72.0 |
| Boston: | 83.7 |
| Cambridge: | 99.2 |
| Watertown: | 12.2 |
| Newton: | 29.6 |
| Somerville: | 56.2 |
| Belmont: | 42.3 |
| Needham: | 17.8 |
| Milton: | 54.6 |
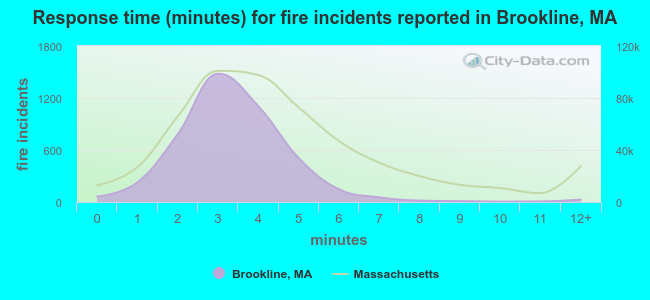 The median response time based on all reported fire incidents is 3 minutes. This is lower compared to the Massachusetts median value.
The median response time in Brookline, MA compared to nearest cities:
(Note: Based on data for all years, including only cities with at least 500 fire incidents)
| Brookline: | 3 minutes |
| Boston: | 3 minutes |
| Cambridge: | 5 minutes |
| Watertown: | 4 minutes |
| Newton: | 5 minutes |
| Somerville: | 3 minutes |
| Belmont: | 4 minutes |
| Needham: | 4 minutes |
| Milton: | 3 minutes |
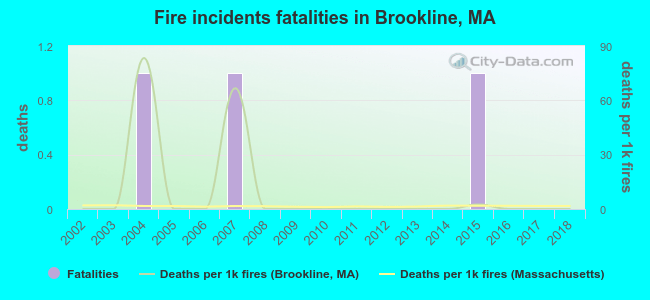 Based on the reports from the years 2002 - 2018 the average number of fire-related yearly deaths is 0. The highest number of reported deaths - 1 took place in 2004, and the lowest - 0 in 2002. The data has a constant trend.
The average number of fatalities per 1,000 fires is 9. This indicator was the highest - 83 in 2004, and the lowest 0 in 2002. The trend for fatalities per 1,000 incidents is constant. Compared to the Massachusetts value the number of fatalities per 1,000 fire incidents is much lower.
Based on the reports from the years 2002 - 2018 the average number of fire-related yearly deaths is 0. The highest number of reported deaths - 1 took place in 2004, and the lowest - 0 in 2002. The data has a constant trend.
The average number of fatalities per 1,000 fires is 9. This indicator was the highest - 83 in 2004, and the lowest 0 in 2002. The trend for fatalities per 1,000 incidents is constant. Compared to the Massachusetts value the number of fatalities per 1,000 fire incidents is much lower.
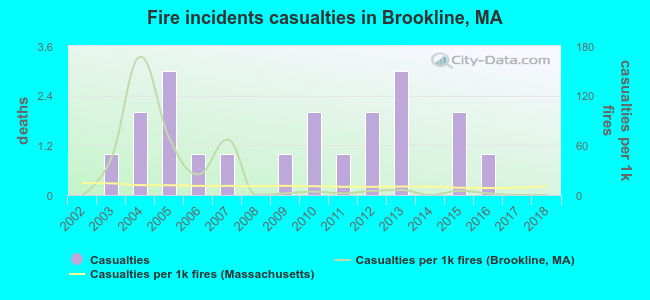 Based on the data from the years 2002 - 2018 the average number of fire-related casualties per year is 1. The highest number of casualties - 3 took place in 2005, and the lowest - 0 in 2002. The data has a constant trend.
The average number of injuries per 1,000 fires is 23. This indicator was the highest - 167 in 2004, and the lowest 0 in 2002. The trend for injuries per 1,000 fires is constant. Compared to the state value the number of injuries per 1,000 fires is much lower.
Based on the data from the years 2002 - 2018 the average number of fire-related casualties per year is 1. The highest number of casualties - 3 took place in 2005, and the lowest - 0 in 2002. The data has a constant trend.
The average number of injuries per 1,000 fires is 23. This indicator was the highest - 167 in 2004, and the lowest 0 in 2002. The trend for injuries per 1,000 fires is constant. Compared to the state value the number of injuries per 1,000 fires is much lower.
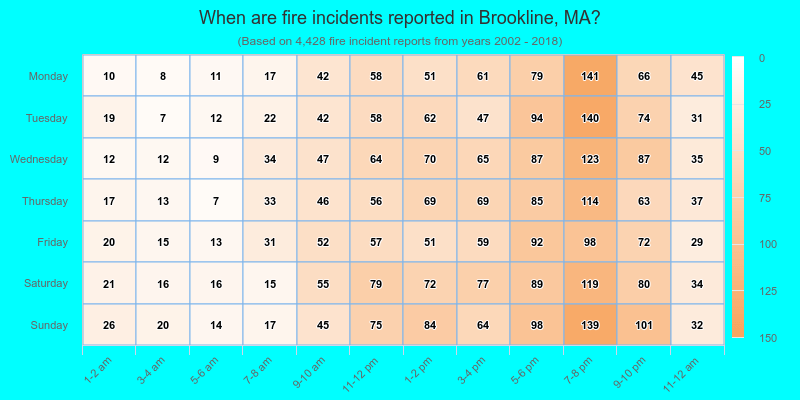
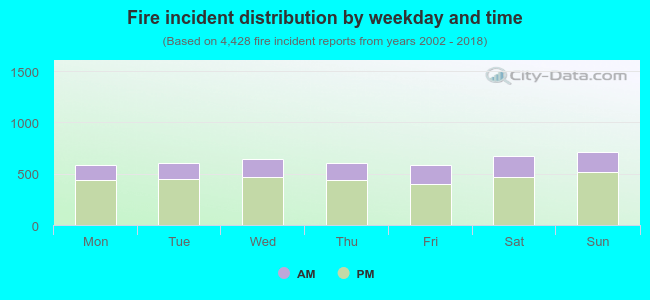 28.1% incidents where reported in the morning and 71.9% in the evening. The most fires (16.1%) took place on Sunday, and the least (13.3%) on Monday.
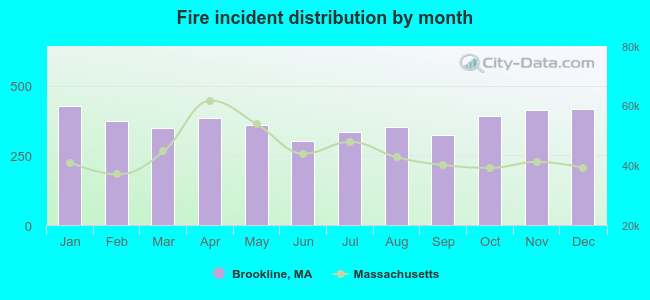 Based on the 4,428 fires from years 2002 - 2018 most fires (9.7%) took place during January, and the least (6.8%) in June.
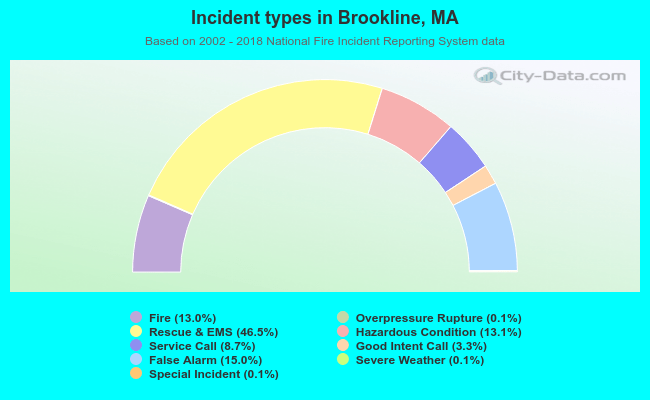 Out of all 34,044 cases reported during the years 2002 - 2018, the most belonged to the categories: Rescue & EMS (46.5%), False Alarm (15.0%), and Hazardous Condition (13.1%).
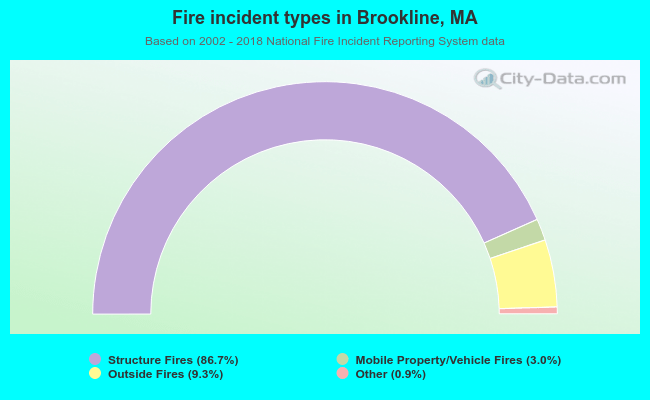 When looking into fire subcategories, the most incidents belonged to: Structure Fires (86.7%), and Outside Fires (9.3%).