| Fire incidents reported |
|---|
| Sreet name | Count |
|---|
| INST 5 SB | 58 | | CHUCKANUT DR | 42 | | ERSHIG RD | 20 | | BARRELL SPRINGS RD | 12 | | COLONY RD | 12 | | ERSHIG RD | 12 | | CHUCKANUT DR | 10 | | BLUE HERON RD | 8 | | COLONY RD | 8 | | HILLWOOD DR | 8 | | 23511 INST 5 SB; BOW HILL TRUC | 6 | | AVON ALLEN RD | 6 | | BOW CEMETERY RD RD | 6 | | BOW HILL RD | 6 | | BRADLEY RD | 6 | | THOMAS RD | 6 | | ALLEN RD | 4 | | CHUCKANUT DRIVE | 4 | | CHUCKANUT MOUNTAIN DR | 4 | | COLONY ROAD | 4 | | COOK RD | 4 | | FARM TO MARKET RD RD | 4 | | HALLORAN RD | 4 | | I-5 SB 240 | 4 | | MOUNTAIN DR | 4 |
| | | Fire incidents reported |
|---|
| Sreet name | Count |
|---|
| RONEY RD | 4 | | SAMISH HEIGHTS RD | 4 | | SAMISH ISLAND RD | 4 | | TOAD LN | 4 | | WORLINE RD | 4 | | WORLINE RD | 4 | | 11317 SAMISH ISLAND | 2 | | 15770 MOUNTAIN DR | 2 | | 16112 PARK PLACE | 2 | | 16281 BRADLEY RD. | 2 | | 17380 SAMISH HEIGHTS RD | 2 | | 17485 ALLEN ROAD | 2 | | 17499 COLONY RD AND HOBSON RD; | 2 | | 17867 WOOD RD. | 2 | | 18279 BOW HILL RD AND INST 5 S | 2 | | 18444 BOW RIDGE DR. | 2 | | 18520 BOW HILL RD | 2 | | 20237 ECHO HILL RD. | 2 | | 23403 INST 5 SB; 234 INST 5 SB | 2 | | 236 I-5 SB | 2 | | 23603 INST 5 SB; 236 I5 SB MP | 2 | | 23603 INST 5 SB; 236 INST 5 SB | 2 | | 237 I-5 NB | 2 | | 238 SB I-5 | 2 | | |
|
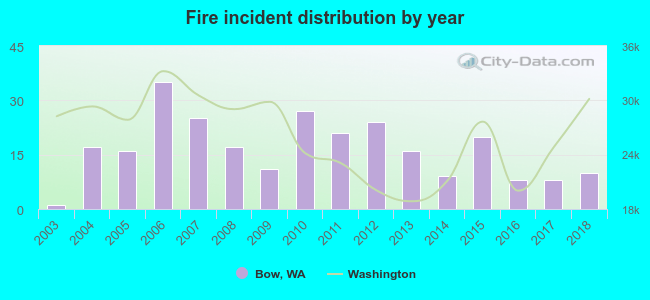 Based on the data from the years 2003 - 2018 the average number of fires per year is 17. The highest number of reported fires - 35 took place in 2006, and the least - 1 in 2003. The data has a growing trend.
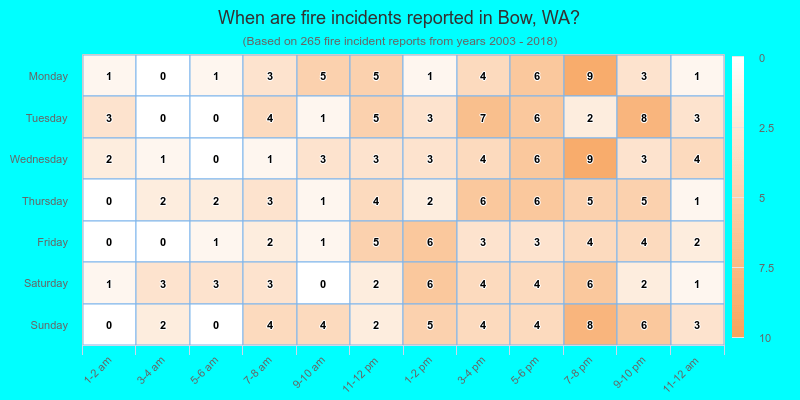
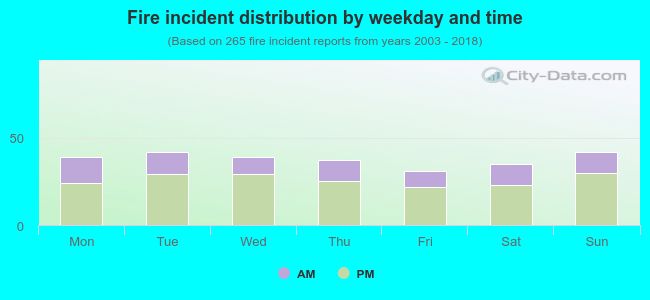 31.3% incidents where reported in the morning and 68.7% in the evening. The most fires (15.8%) took place on Tuesday, and the least (11.7%) on Friday.
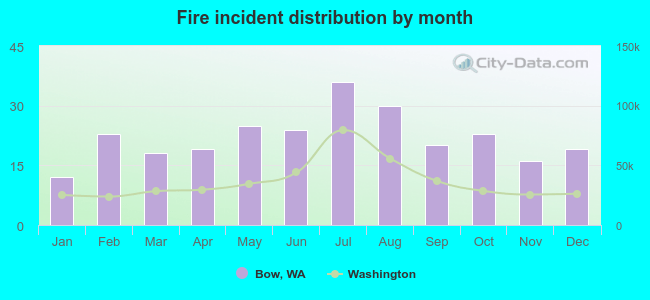 Based on the 265 incident reports from years 2003 - 2018 most fires (13.6%) took place during July, and the least (4.5%) in January.
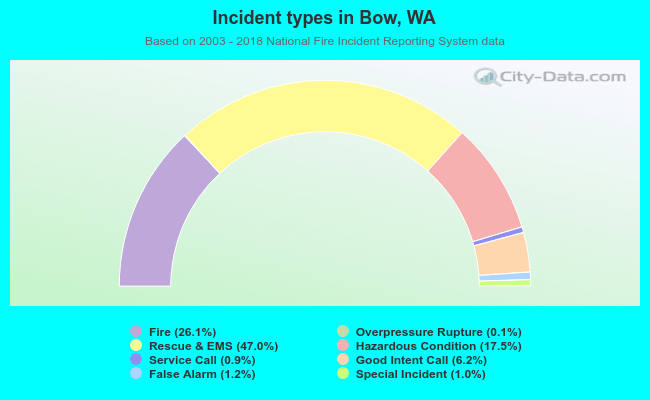 Out of all 1,016 cases reported during the years 2003 - 2018, the most belonged to the categories: Rescue & EMS (47.0%), Fire (26.1%), and Hazardous Condition (17.5%).
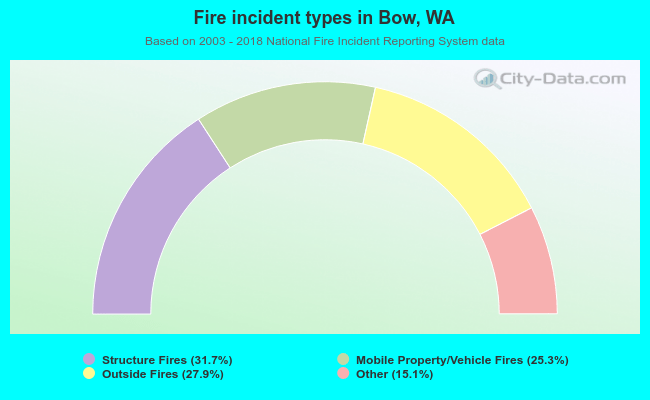 When looking into fire subcategories, the most incidents belonged to: Structure Fires (31.7%), and Outside Fires (27.9%).