Bellingham: Fire Incidents, Washington (WA)
Where are fire incidents reported in Bellingham, WA
Something went wrong! Please refresh the page.
| Fire incidents reported | |
|---|---|
| Sreet name | Count |
| MARINE DR | 472 |
| MERIDIAN ST | 348 |
| LUMMI SHORE RD | 334 |
| BAKERVIEW RD | 218 |
| HOLLY ST | 190 |
| LUMMI VIEW DR | 182 |
| GUIDE MERIDIAN RD | 174 |
| SMITH RD | 158 |
| AXTON RD | 150 |
| HAXTON WAY | 140 |
| SUNSET DR | 128 |
| LAKEWAY DR | 126 |
| CORNWALL AV | 122 |
| BENNETT DR | 118 |
| CHUCKANUT DR | 112 |
| STATE ST | 110 |
| BELLIS FAIR PK | 108 |
| GARDEN ST | 106 |
| LOCUST AVE | 106 |
| YEW STREET RD | 104 |
| HANNEGAN RD | 102 |
| NORTHWEST AV | 96 |
| MAPLEWOOD AV | 94 |
| I5 | 92 |
| ALABAMA ST | 90 |
| CAGEY RD | 88 |
| ALDRICH RD | 82 |
| FOREST ST | 82 |
| NORTHSHORE RD | 80 |
| BIRCHWOOD AV | 78 |
| Other | 2,106 |
2002 - 2018 National Fire Incident Reporting System (NFIRS) incidents
- Incident types reported to NFIRS in Bellingham, WA
- 33,29265.1%Rescue & EMS
- 6,49612.7%Fire
- 3,0986.1%Good Intent Call
- 2,7835.4%Hazardous Condition
- 2,6525.2%Service Call
- 2,6355.2%False Alarm
- 1100.2%Special Incident
- 730.1%Overpressure Rupture
- Fire incident types reported to NFIRS in Bellingham, WA
- 3,14848.5%Outside Fires
- 2,17833.5%Structure Fires
- 86413.3%Mobile Property/Vehicle Fires
- 3064.7%Other
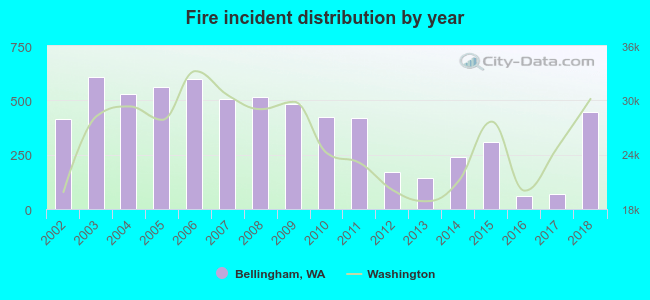 Based on the data from the years 2002 - 2018 the average number of fires per year is 382. The highest number of fires - 608 took place in 2003, and the least - 60 in 2016. The data has a growing trend.
The average number of yearly fire incidents per 10k residents in Bellingham, WA compared to nearest cities:
(Note: Based on data for the last 3 years, including only cities with population 5,000 and above)
| Bellingham: | 23.1 |
| Sudden Valley: | 1.6 |
| Ferndale: | 73.2 |
| Bow: | 14.2 |
| Lynden: | 57.5 |
| Birch Bay: | 8.3 |
| Anacortes: | 66.5 |
| Burlington: | 91.4 |
| Mount Vernon: | 19.3 |
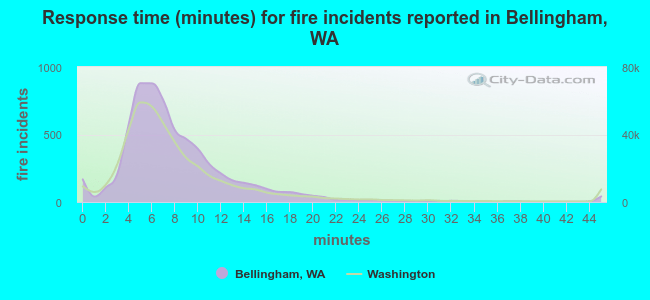 The median response time based on all reported fire incidents is 7 minutes. This is comparable to the Washington median value.
The median response time in Bellingham, WA compared to nearest cities:
(Note: Based on data for all years, including only cities with at least 500 fire incidents)
| Bellingham: | 7 minutes |
| Ferndale: | 9 minutes |
| Lynden: | 9 minutes |
| Anacortes: | 7 minutes |
| Burlington: | 6 minutes |
| Blaine: | 8 minutes |
| Mount Vernon: | 7 minutes |
| Oak Harbor: | 5 minutes |
| Stanwood: | 8 minutes |
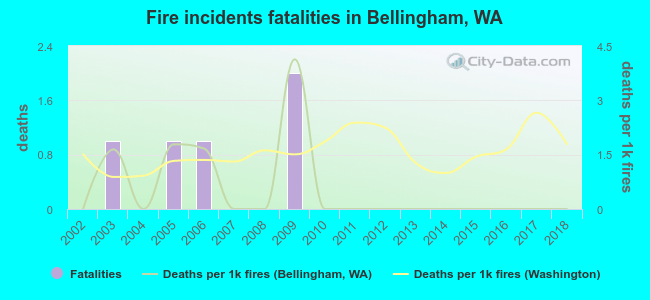 Based on the data from the years 2002 - 2018 the average number of fire-related fatalities per year is 0. The highest number of deaths - 2 took place in 2009, and the lowest - 0 in 2002. The data has a constant trend.
The average number of deaths per 1,000 fires is 1. This indicator was the highest - 4 in 2009, and the lowest 0 in 2002. The trend for fatalities per 1,000 fire incidents is constant. Compared to the Washington value the number of fatalities per 1,000 incidents is much lower.
Based on the data from the years 2002 - 2018 the average number of fire-related fatalities per year is 0. The highest number of deaths - 2 took place in 2009, and the lowest - 0 in 2002. The data has a constant trend.
The average number of deaths per 1,000 fires is 1. This indicator was the highest - 4 in 2009, and the lowest 0 in 2002. The trend for fatalities per 1,000 fire incidents is constant. Compared to the Washington value the number of fatalities per 1,000 incidents is much lower.Deaths per 1,000 incidents in Bellingham, WA compared to nearest cities:
(Note: Based on data for all years, including only cities with at least 2,500 fire incidents)
| Bellingham: | 0.8 |
| Arlington: | 4.0 |
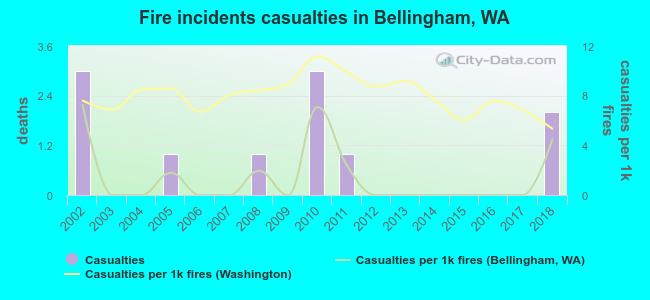 According to the data from the years 2002 - 2018 the average number of fire-related yearly casualties is 1. The highest number of injuries - 3 took place in 2002, and the lowest - 0 in 2003. The data has a declining trend.
The average number of casualties per 1,000 fire incidents is 1. This indicator was the highest - 7 in 2002, and the lowest 0 in 2003. The trend for injuries per 1,000 incidents is declining. Compared to the state value the number of injuries per 1,000 fires is much lower.
According to the data from the years 2002 - 2018 the average number of fire-related yearly casualties is 1. The highest number of injuries - 3 took place in 2002, and the lowest - 0 in 2003. The data has a declining trend.
The average number of casualties per 1,000 fire incidents is 1. This indicator was the highest - 7 in 2002, and the lowest 0 in 2003. The trend for injuries per 1,000 incidents is declining. Compared to the state value the number of injuries per 1,000 fires is much lower.Casualties per 1,000 incidents in Bellingham, WA compared to nearest cities:
(Note: Based on data for all years, including only cities with at least 500 fire incidents)
| Bellingham: | 1.7 |
| Ferndale: | 2.2 |
| Lynden: | 0.0 |
| Anacortes: | 6.2 |
| Burlington: | 2.5 |
| Blaine: | 5.3 |
| Mount Vernon: | 4.3 |
| Oak Harbor: | 9.9 |
| Stanwood: | 0.5 |
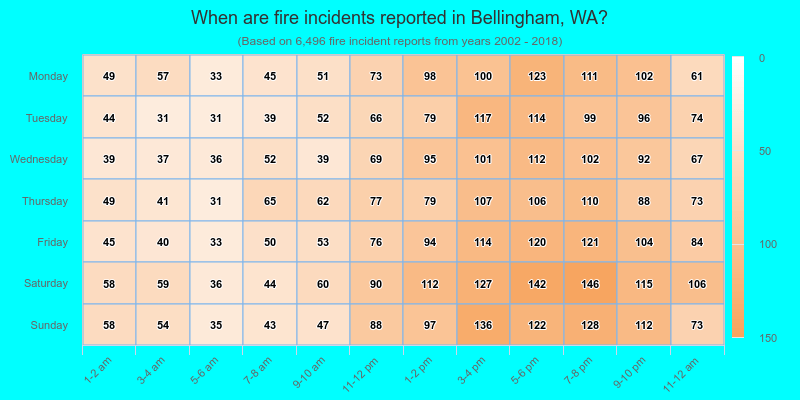
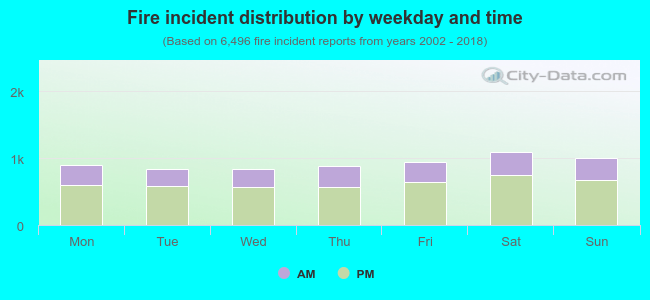 32.9% incidents where reported in the morning and 67.1% in the evening. The most fires (16.9%) took place on Saturday, and the least (12.9%) on Wednesday.
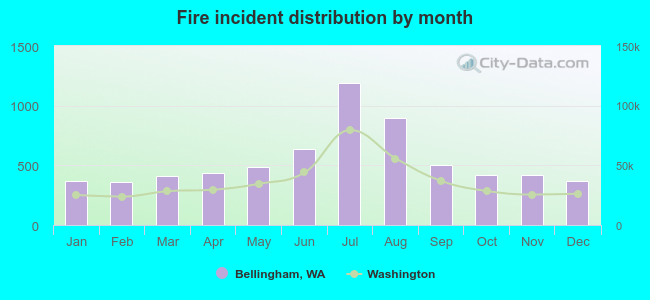 According to the 6,496 fires from years 2002 - 2018 most fires (18.3%) took place during July, and the least (5.6%) in February.
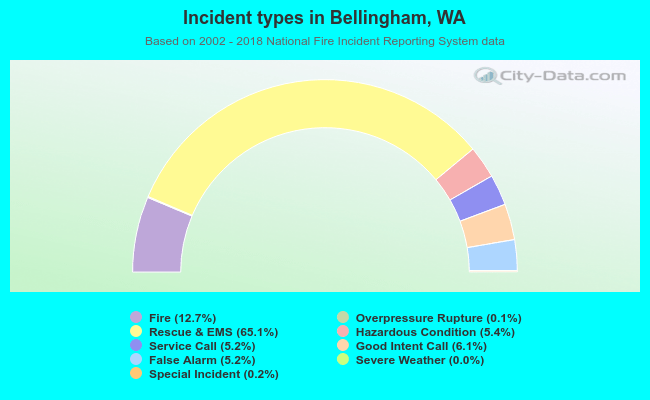 Out of all 51,147 cases reported during the years 2002 - 2018, the most belonged to the categories: Rescue & EMS (65.1%), Fire (12.7%), and Good Intent Call (6.1%).
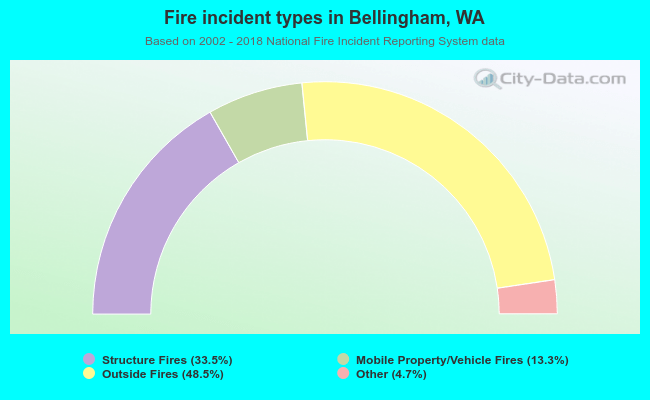 When looking into fire subcategories, the most incidents belonged to: Outside Fires (48.5%), and Structure Fires (33.5%).