Bowling Green: Fire Incidents, Kentucky (KY)
Where are fire incidents reported in Bowling Green, KY
Something went wrong! Please refresh the page.
| Fire incidents reported | |
|---|---|
| Sreet name | Count |
| SCOTTSVILLE RD | 414 |
| NASHVILLE RD | 256 |
| RUSSELLVILLE RD | 230 |
| LOUISVILLE RD | 138 |
| MORGANTOWN RD | 138 |
| US HWY 31W BYP | 122 |
| CAMPBELL LN | 120 |
| SCOTTSVILLE RD | 120 |
| OLD LOUISVILLE RD | 102 |
| CHESTNUT ST | 92 |
| THREE SPRINGS RD | 92 |
| CLAY ST | 90 |
| OLD MORGANTOWN RD | 86 |
| COLLEGE ST | 84 |
| PLANO RD | 72 |
| GLEN LILY RD | 68 |
| KENTUCKY ST | 64 |
| RUSSELLVILLE RD | 64 |
| AVENUE OF CHAMPIONS | 60 |
| BRYANT WAY | 60 |
| PARK ST | 60 |
| BARREN RIVER RD | 58 |
| FAIRVIEW AV | 56 |
| WOODFORD AV | 56 |
| STATE ST | 54 |
| 12TH AV | 52 |
| ADAMS ST | 52 |
| CAVE MILL RD | 50 |
| DYE FORD RD | 50 |
| MEL BROWNING ST | 48 |
| Other | 3,434 |
2002 - 2018 National Fire Incident Reporting System (NFIRS) incidents
- Incident types reported to NFIRS in Bowling Green, KY
- 24,96156.1%Rescue & EMS
- 6,44214.5%Fire
- 4,81010.8%Good Intent Call
- 3,8018.5%False Alarm
- 2,7686.2%Hazardous Condition
- 1,4033.2%Service Call
- 1580.4%Severe Weather
- 1080.2%Overpressure Rupture
- 610.1%Special Incident
- Fire incident types reported to NFIRS in Bowling Green, KY
- 2,69741.9%Outside Fires
- 2,64041.0%Structure Fires
- 99315.4%Mobile Property/Vehicle Fires
- 1121.7%Other
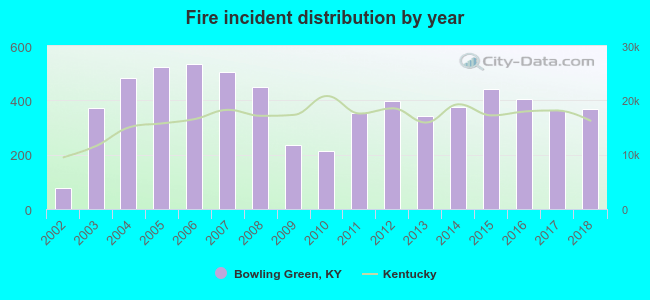 Based on the data from the years 2002 - 2018 the average number of fires per year is 379. The highest number of fire incidents - 534 took place in 2006, and the least - 77 in 2002. The data has an increasing trend.
The average number of yearly fire incidents per 10k residents in Bowling Green, KY compared to nearest cities:
(Note: Based on data for the last 3 years, including only cities with population 5,000 and above)
| Bowling Green: | 60.7 |
| Franklin: | 56.0 |
| Russellville: | 86.2 |
| Glasgow: | 123.7 |
| Leitchfield: | 84.4 |
 The median response time based on all reported fire incidents is 6 minutes. This is about the same as the Kentucky median value.
The median response time in Bowling Green, KY compared to nearest cities:
(Note: Based on data for all years, including only cities with at least 500 fire incidents)
| Bowling Green: | 6 minutes |
| Smiths Grove: | 12 minutes |
| Franklin: | 8 minutes |
| Scottsville: | 10 minutes |
| Morgantown: | 16 minutes |
| Russellville: | 5 minutes |
| Glasgow: | 7 minutes |
| Leitchfield: | 4 minutes |
 Based on the data from the years 2002 - 2018 the average number of fire-related yearly deaths is 1. The highest number of reported deaths - 4 took place in 2005, and the lowest - 0 in 2002. The data has a constant trend.
The average number of deaths per 1,000 fires is 2. This indicator was the highest - 8 in 2005, and the lowest 0 in 2002. The trend for deaths per 1,000 incidents is constant. Compared to the state value the number of deaths per 1,000 fires is lower.
Based on the data from the years 2002 - 2018 the average number of fire-related yearly deaths is 1. The highest number of reported deaths - 4 took place in 2005, and the lowest - 0 in 2002. The data has a constant trend.
The average number of deaths per 1,000 fires is 2. This indicator was the highest - 8 in 2005, and the lowest 0 in 2002. The trend for deaths per 1,000 incidents is constant. Compared to the state value the number of deaths per 1,000 fires is lower.Deaths per 1,000 incidents in Bowling Green, KY compared to nearest cities:
(Note: Based on data for all years, including only cities with at least 2,500 fire incidents)
| Bowling Green: | 2.0 |
 According to the data from the years 2002 - 2018 the average number of fire-related yearly casualties is 2. The highest number of injuries - 7 took place in 2003, and the lowest - 0 in 2002. The data has a growing trend.
The average number of injuries per 1,000 fires is 4. This indicator was the highest - 19 in 2003, and the lowest 0 in 2002. The trend for injuries per 1,000 incidents is growing. Compared to the Kentucky value the number of casualties per 1,000 fire incidents is lower.
According to the data from the years 2002 - 2018 the average number of fire-related yearly casualties is 2. The highest number of injuries - 7 took place in 2003, and the lowest - 0 in 2002. The data has a growing trend.
The average number of injuries per 1,000 fires is 4. This indicator was the highest - 19 in 2003, and the lowest 0 in 2002. The trend for injuries per 1,000 incidents is growing. Compared to the Kentucky value the number of casualties per 1,000 fire incidents is lower.Casualties per 1,000 incidents in Bowling Green, KY compared to nearest cities:
(Note: Based on data for all years, including only cities with at least 500 fire incidents)
| Bowling Green: | 4.0 |
| Smiths Grove: | 0.0 |
| Franklin: | 5.6 |
| Scottsville: | 1.9 |
| Morgantown: | 1.3 |
| Russellville: | 1.0 |
| Glasgow: | 5.2 |
| Leitchfield: | 0.0 |
 31.5% incidents where reported in the morning and 68.5% in the evening. The most fires (15.0%) took place on Saturday, and the least (13.6%) on Sunday.
 Based on the 6,442 fires from years 2002 - 2018 most fires (10.5%) took place during March, and the least (6.7%) in December.
 Out of all 44,512 cases reported during the years 2002 - 2018, the most belonged to the categories: Rescue & EMS (56.1%), Fire (14.5%), and Good Intent Call (10.8%).
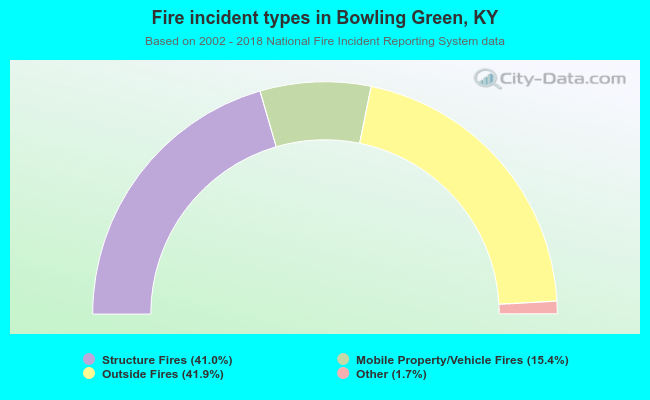 When looking into fire subcategories, the most incidents belonged to: Outside Fires (41.9%), and Structure Fires (41.0%).