Russellville: Fire Incidents, Kentucky (KY)
Where are fire incidents reported in Russellville, KY
Something went wrong! Please refresh the page.
|
| |||||||||||||||||||||||||||||||||||||||||||||||||||||||||||||||||||||||||||||||||||||||||||||||||||||||||||||
| Other | 140 | |||||||||||||||||||||||||||||||||||||||||||||||||||||||||||||||||||||||||||||||||||||||||||||||||||||||||||||
2002 - 2018 National Fire Incident Reporting System (NFIRS) incidents
- Incident types reported to NFIRS in Russellville, KY
- 4,39861.3%Rescue & EMS
- 1,01214.1%Fire
- 80811.3%Hazardous Condition
- 3374.7%Service Call
- 2854.0%Good Intent Call
- 2693.8%False Alarm
- 450.6%Special Incident
- 110.2%Severe Weather
- Fire incident types reported to NFIRS in Russellville, KY
- 38838.3%Outside Fires
- 38337.8%Structure Fires
- 16015.8%Mobile Property/Vehicle Fires
- 818.0%Other
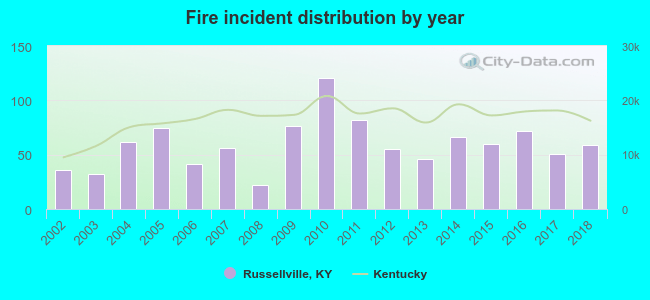 Based on the data from the years 2002 - 2018 the average number of fires per year is 60. The highest number of reported fire incidents - 121 took place in 2010, and the least - 22 in 2008. The data has an increasing trend.
The average number of yearly fire incidents per 10k residents in Russellville, KY compared to nearest cities:
(Note: Based on data for the last 3 years, including only cities with population 5,000 and above)
| Russellville: | 86.2 |
| Franklin: | 56.0 |
| Bowling Green: | 60.7 |
| Oak Grove: | 60.3 |
| Hopkinsville: | 52.9 |
| Central City: | 99.5 |
 The median response time based on all reported fire incidents is 5 minutes. This is lower compared to the Kentucky median value.
The median response time in Russellville, KY compared to nearest cities:
(Note: Based on data for all years, including only cities with at least 500 fire incidents)
| Russellville: | 5 minutes |
| Franklin: | 8 minutes |
| Bowling Green: | 6 minutes |
| Morgantown: | 16 minutes |
| Greenville: | 11 minutes |
| Oak Grove: | 7 minutes |
| Hopkinsville: | 6 minutes |
| Central City: | 8 minutes |
| Scottsville: | 10 minutes |
 31.5% incidents where reported in the morning and 68.5% in the evening. The most fires (15.5%) took place on Monday, and the least (13.1%) on Sunday.
 Based on the 1,012 incident reports from years 2002 - 2018 most fires (10.1%) took place during March, and the least (6.2%) in June.
 Out of all 7,169 cases reported during the years 2002 - 2018, the most belonged to the categories: Rescue & EMS (61.3%), Fire (14.1%), and Hazardous Condition (11.3%).
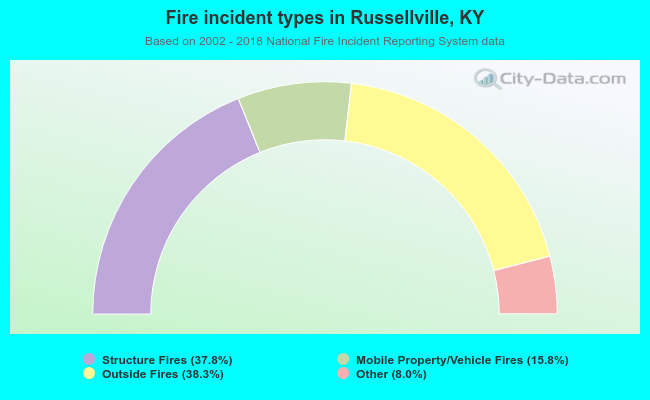 When looking into fire subcategories, the most incidents belonged to: Outside Fires (38.3%), and Structure Fires (37.8%).