Bowling Green: Fire Incidents, Missouri (MO)
Where are fire incidents reported in Bowling Green, MO
Something went wrong! Please refresh the page.
|
| |||||||||||||||||||||||||||||||||||||||||||||||||||||||||||||||||||||||||||||||||||||||||||||||||||||||||||||
2002 - 2018 National Fire Incident Reporting System (NFIRS) incidents
- Incident types reported to NFIRS in Bowling Green, MO
- 13350.0%Fire
- 5219.5%Hazardous Condition
- 2710.2%Good Intent Call
- 2710.2%False Alarm
- 176.4%Rescue & EMS
- 103.8%Service Call
- Fire incident types reported to NFIRS in Bowling Green, MO
- 6145.9%Outside Fires
- 4735.3%Structure Fires
- 1914.3%Mobile Property/Vehicle Fires
- 64.5%Other
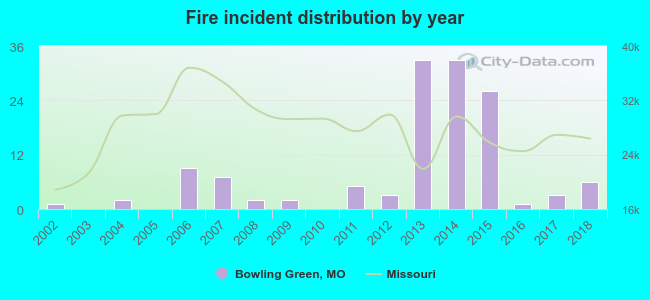 Based on the data from the years 2002 - 2018 the average number of fire incidents per year is 8. The highest number of fires - 33 took place in 2013, and the least - 0 in 2003. The data has a growing trend.

 28.6% incidents where reported in the morning and 71.4% in the evening. The most fires (19.5%) took place on Sunday, and the least (9.8%) on Monday.
 Based on the 133 fire incident reports from years 2002 - 2018 most fires (18.8%) took place during March, and the least (1.5%) in May.
 Out of all 266 cases reported during the years 2002 - 2018, the most belonged to the categories: Fire (50.0%), Rescue & EMS (19.5%), and Service Call (10.2%).
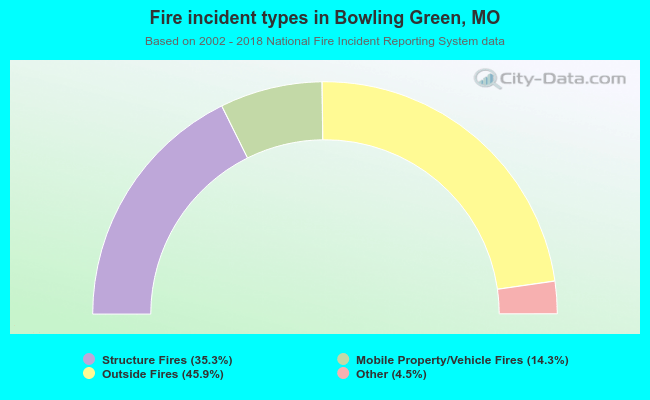 When looking into fire subcategories, the most reports belonged to: Outside Fires (45.9%), and Structure Fires (35.3%).