Hannibal: Fire Incidents, Missouri (MO)
Where are fire incidents reported in Hannibal, MO
Something went wrong! Please refresh the page.
| Fire incidents reported | |
|---|---|
| Sreet name | Count |
| BROADWAY | 118 |
| MARKET ST | 72 |
| MARKET | 60 |
| CHESTNUT | 54 |
| FULTON AVE | 48 |
| HOPE | 46 |
| HOPE ST | 40 |
| 7TH ST | 32 |
| STARDUST DR | 32 |
| CHESTNUT ST | 30 |
| CHURCH ST | 30 |
| MUNGER LN | 30 |
| US 61 HWY | 30 |
| WARREN BARRETT DR | 30 |
| BIRD ST | 28 |
| PARIS GRAVEL RD | 28 |
| BIRD | 26 |
| CENTER ST | 26 |
| CHURCH | 26 |
| JAMES RD | 26 |
| PARIS AVE | 26 |
| PARK AVE | 26 |
| VALLEY ST | 26 |
| BROADWAY ST | 24 |
| GRACE ST | 24 |
| MAIN ST | 24 |
| SPRUCE ST | 24 |
| 61 HWY | 22 |
| ARCH ST | 22 |
| GRAND AVE | 22 |
| Other | 1,123 |
2002 - 2018 National Fire Incident Reporting System (NFIRS) incidents
- Incident types reported to NFIRS in Hannibal, MO
- 6,08952.6%Rescue & EMS
- 2,17518.8%Fire
- 1,20810.4%Good Intent Call
- 9898.6%Hazardous Condition
- 5825.0%False Alarm
- 4654.0%Service Call
- 450.4%Special Incident
- 120.1%Overpressure Rupture
- Fire incident types reported to NFIRS in Hannibal, MO
- 1,14552.6%Outside Fires
- 52023.9%Structure Fires
- 31914.7%Mobile Property/Vehicle Fires
- 1918.8%Other
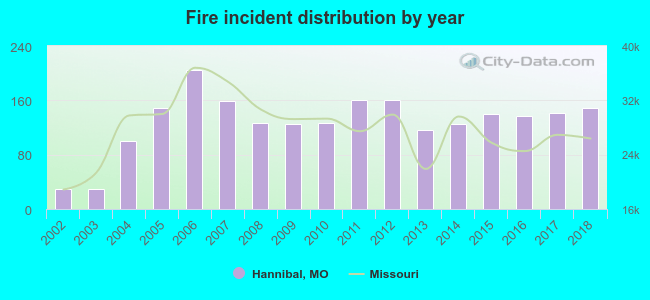 According to the data from the years 2002 - 2018 the average number of fire incidents per year is 128. The highest number of fires - 204 took place in 2006, and the least - 29 in 2002. The data has a rising trend.
The average number of yearly fire incidents per 10k residents in Hannibal, MO compared to nearest cities:
(Note: Based on data for the last 3 years, including only cities with population 5,000 and above)
| Hannibal: | 79.5 |
| Bowling Green: | 6.1 |
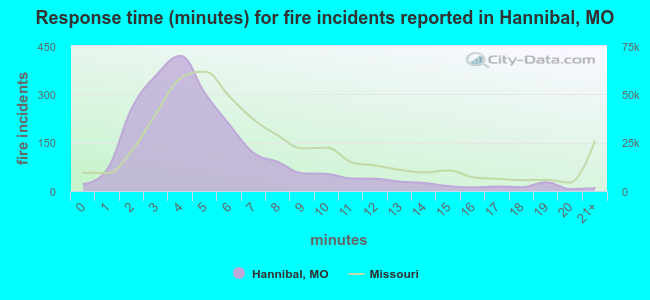 The median response time based on all reported fire incidents is 4 minutes. This is lower than the state median value.
The median response time in Hannibal, MO compared to nearest cities:
(Note: Based on data for all years, including only cities with at least 500 fire incidents)
| Hannibal: | 4 minutes |
| Quincy: | 4 minutes |
| Pittsfield: | 8 minutes |
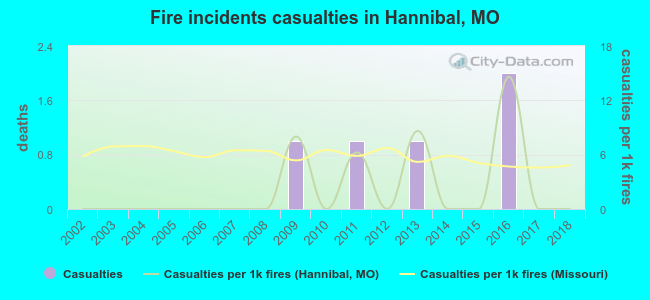 Based on the reports from the years 2002 - 2018 the average number of fire-related yearly casualties is 0. The highest number of casualties - 2 took place in 2016, and the lowest - 0 in 2002. The data has a constant trend.
The average number of injuries per 1,000 fire incidents is 2. This indicator was the highest - 15 in 2016, and the lowest 0 in 2002. The trend for injuries per 1,000 fire incidents is constant. Compared to the Missouri value the number of injuries per 1,000 fire incidents is much lower.
Based on the reports from the years 2002 - 2018 the average number of fire-related yearly casualties is 0. The highest number of casualties - 2 took place in 2016, and the lowest - 0 in 2002. The data has a constant trend.
The average number of injuries per 1,000 fire incidents is 2. This indicator was the highest - 15 in 2016, and the lowest 0 in 2002. The trend for injuries per 1,000 fire incidents is constant. Compared to the Missouri value the number of injuries per 1,000 fire incidents is much lower.Casualties per 1,000 incidents in Hannibal, MO compared to nearest cities:
(Note: Based on data for all years, including only cities with at least 500 fire incidents)
| Hannibal: | 2.3 |
| Quincy: | 21.1 |
| Pittsfield: | 1.9 |
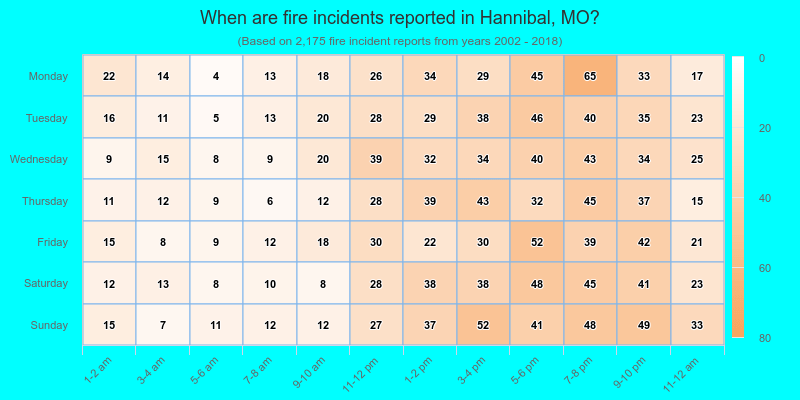
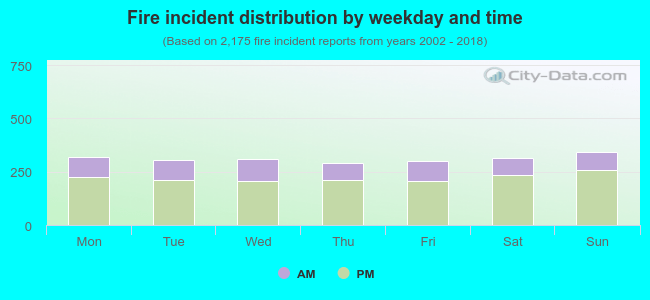 28.6% incidents where reported in the morning and 71.4% in the evening. The most fires (15.8%) took place on Sunday, and the least (13.3%) on Thursday.
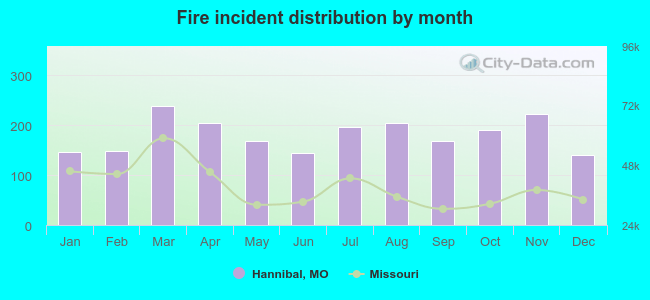 Based on the 2,175 incident reports from years 2002 - 2018 most fires (11.0%) took place during March, and the least (6.5%) in December.
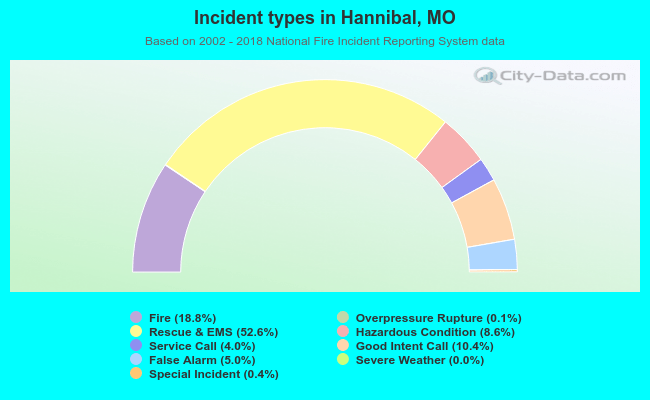 Out of all 11,566 cases reported during the years 2002 - 2018, the most belonged to the categories: Rescue & EMS (52.6%), Fire (18.8%), and Good Intent Call (10.4%).
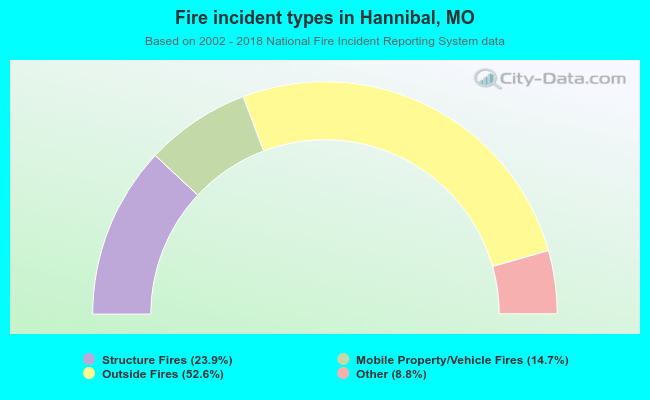 When looking into fire subcategories, the most incidents belonged to: Outside Fires (52.6%), and Structure Fires (23.9%).