Boys Town: Fire Incidents, Nebraska (NE)
Where are fire incidents reported in Boys Town, NE
Something went wrong! Please refresh the page.
| Fire incidents reported | |
|---|---|
| Sreet name | Count |
| WALSH DR | 256 |
| FLANAGAN BLVD | 208 |
| MAHER DR | 144 |
| FARM CIR | 136 |
| GIANNELLI CIR | 106 |
| MOTHER TERESA LN | 74 |
| ALEXIAN CIR | 66 |
| SUDYKA DR | 62 |
| MOTHER TERESA LANE | 52 |
| FRANCISCAN CIR | 48 |
| DOYLE DR | 40 |
| BOYS TOWN HOSPITAL RD | 32 |
| GUTOWSKI RD | 22 |
| NORTON DR | 22 |
| KUHN DR | 20 |
| FARM RD | 18 |
| BT HOSPITAL RD | 16 |
| MAHONEY RD | 16 |
| CRAWFORD RD | 14 |
| DOWD DR | 12 |
| HEROES BLVD | 12 |
| CRAWFORD ST | 10 |
| MOTHER LN | 8 |
| BUCHER DR | 6 |
| LACHIMIA RD | 6 |
| MCBREEN CIR | 6 |
| BOYS RD | 4 |
| GIANELLI CIR | 4 |
| MAHONEY DR | 4 |
| MOTHER THERESA LANE | 4 |
2002 - 2018 National Fire Incident Reporting System (NFIRS) incidents
- Incident types reported to NFIRS in Boys Town, NE
- 73559.7%Fire
- 23919.4%Hazardous Condition
- 1199.7%Rescue & EMS
- 907.3%False Alarm
- 201.6%Severe Weather
- 121.0%Overpressure Rupture
- 110.9%Service Call
- 60.5%Good Intent Call
- Fire incident types reported to NFIRS in Boys Town, NE
- 71397.0%Structure Fires
- 121.6%Outside Fires
- 50.7%Mobile Property/Vehicle Fires
- 50.7%Other
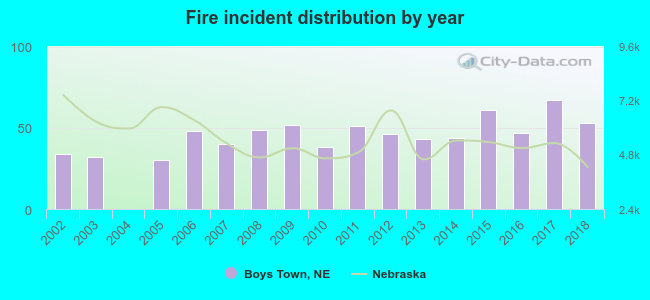 Based on the data from the years 2002 - 2018 the average number of fire incidents per year is 43. The highest number of fire incidents - 67 took place in 2017, and the least - 0 in 2004. The data has an increasing trend.
 The median response time based on all reported fire incidents is 4 minutes. This is lower than the Nebraska median value.
The median response time in Boys Town, NE compared to nearest cities:
(Note: Based on data for all years, including only cities with at least 500 fire incidents)
| Boys Town: | 4 minutes |
| Omaha: | 5 minutes |
| Bellevue: | 6 minutes |
| Council Bluffs: | 7 minutes |
| Ashland: | 8 minutes |
| Fremont: | 5 minutes |
 33.3% incidents where reported in the morning and 66.7% in the evening. The most fires (16.2%) took place on Tuesday, and the least (10.7%) on Saturday.
 According to the 735 fire incident reports from years 2002 - 2018 most fires (11.0%) took place during June, and the least (5.3%) in February.
 Out of all 1,232 cases reported during the years 2002 - 2018, the most belonged to the categories: Fire (59.7%), Hazardous Condition (19.4%), and Rescue & EMS (9.7%).
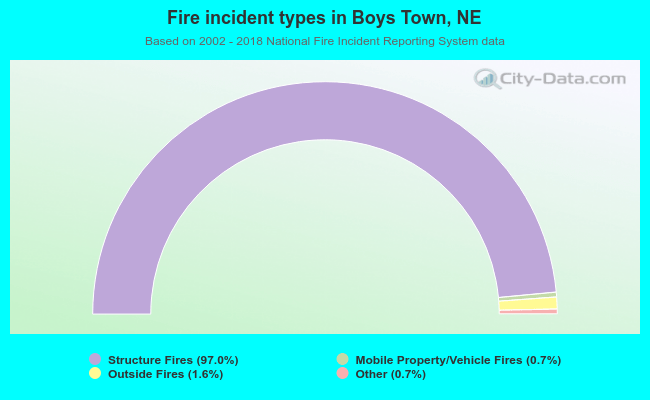 When looking into fire subcategories, the most reports belonged to: Structure Fires (97.0%), and Outside Fires (1.6%).