Bozrah: Fire Incidents, Connecticut (CT)
Where are fire incidents reported in Bozrah, CT
Something went wrong! Please refresh the page.
|
| |||||||||||||||||||||||||||||||||||||||||||||||||||||||||||||||||||||||||||||||||||||||||||||||||||||||||||||
2002 - 2018 National Fire Incident Reporting System (NFIRS) incidents
- Incident types reported to NFIRS in Bozrah, CT
- 49245.4%Rescue & EMS
- 22620.9%Fire
- 11310.4%Good Intent Call
- 1069.8%Hazardous Condition
- 898.2%False Alarm
- 514.7%Service Call
- 30.3%Special Incident
- 20.2%Severe Weather
- Fire incident types reported to NFIRS in Bozrah, CT
- 11751.8%Structure Fires
- 5624.8%Outside Fires
- 3515.5%Mobile Property/Vehicle Fires
- 188.0%Other
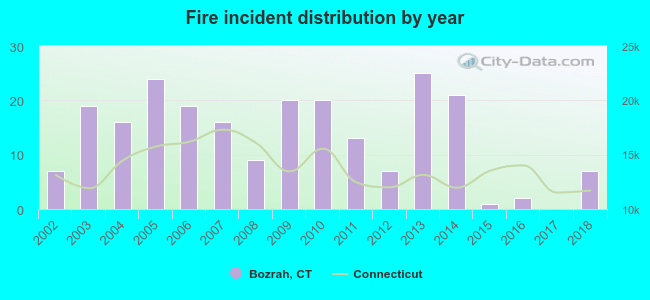 According to the data from the years 2002 - 2018 the average number of fires per year is 13. The highest number of fires - 25 took place in 2013, and the least - 0 in 2017. The data has a constant trend.
 41.2% incidents where reported in the morning and 58.8% in the evening. The most fires (16.4%) took place on Saturday, and the least (8.8%) on Wednesday.
 According to the 226 fire incidents from years 2002 - 2018 most fires (16.4%) took place during April, and the least (4.0%) in September.
 Out of all 1,083 cases reported during the years 2002 - 2018, the most belonged to the categories: Rescue & EMS (45.4%), Fire (20.9%), and Good Intent Call (10.4%).
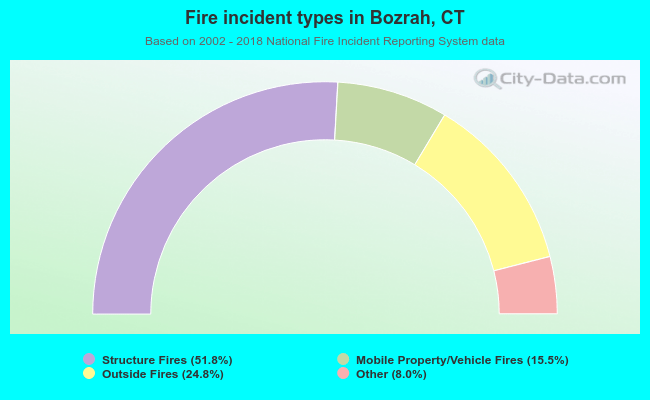 When looking into fire subcategories, the most reports belonged to: Structure Fires (51.8%), and Outside Fires (24.8%).