Brady: Fire Incidents, Texas (TX)
Where are fire incidents reported in Brady, TX
Something went wrong! Please refresh the page.
|
| |||||||||||||||||||||||||||||||||||||||||||||||||||||||||||||||||||||||||||||||||||||||||||||||||||||||||||||
| Other | 550 | |||||||||||||||||||||||||||||||||||||||||||||||||||||||||||||||||||||||||||||||||||||||||||||||||||||||||||||
2002 - 2018 National Fire Incident Reporting System (NFIRS) incidents
- Incident types reported to NFIRS in Brady, TX
- 2,34056.6%Rescue & EMS
- 1,04625.3%Fire
- 2836.8%Hazardous Condition
- 2014.9%Good Intent Call
- 1724.2%Service Call
- 872.1%False Alarm
- Fire incident types reported to NFIRS in Brady, TX
- 60257.6%Outside Fires
- 24923.8%Structure Fires
- 14513.9%Mobile Property/Vehicle Fires
- 504.8%Other
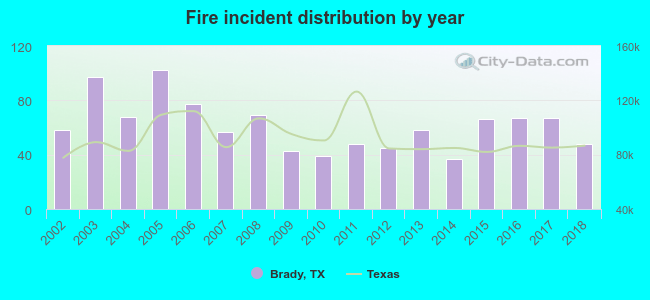 Based on the data from the years 2002 - 2018 the average number of fires per year is 62. The highest number of fires - 102 took place in 2005, and the least - 37 in 2014. The data has a dropping trend.
The average number of yearly fire incidents per 10k residents in Brady, TX compared to nearest cities:
(Note: Based on data for the last 3 years, including only cities with population 5,000 and above)
| Brady: | 111.2 |
| Brownwood: | 74.8 |
| Kingsland: | 7.7 |
| Fredericksburg: | 122.8 |
| Lampasas: | 98.3 |
| San Angelo: | 20.7 |
| Burnet: | 264.5 |
| Marble Falls: | 129.3 |
| Kerrville: | 40.7 |
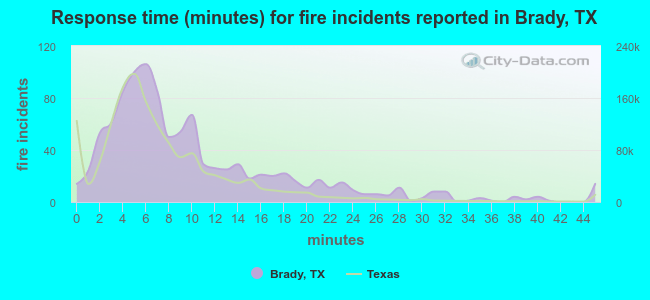 The median response time based on all reported fire incidents is 7 minutes. This is comparable to the Texas median value.
The median response time in Brady, TX compared to nearest cities:
(Note: Based on data for all years, including only cities with at least 500 fire incidents)
| Brady: | 7 minutes |
| San Saba: | 10 minutes |
| Bangs: | 9 minutes |
| Brownwood: | 5 minutes |
| Coleman: | 9 minutes |
| Ballinger: | 8 minutes |
| Fredericksburg: | 11 minutes |
| Lampasas: | 10 minutes |
| San Angelo: | 6 minutes |
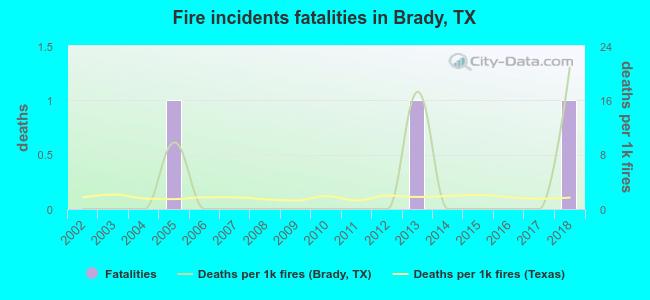 Based on the data from the years 2002 - 2018 the average number of fire-related yearly deaths is 0. The highest number of deaths - 1 took place in 2005, and the lowest - 0 in 2002. The data has a growing trend.
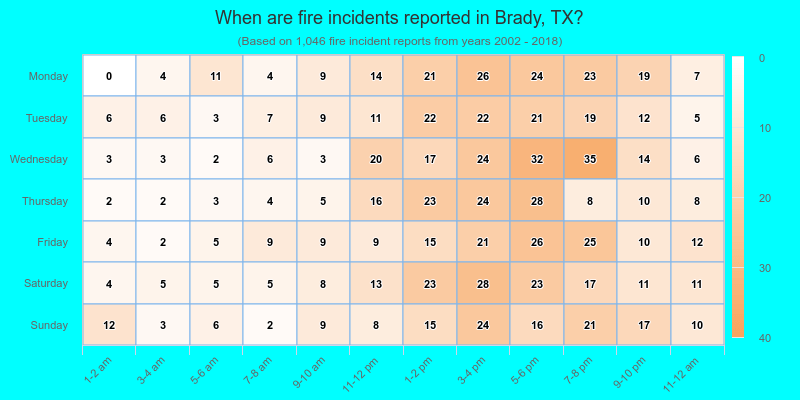
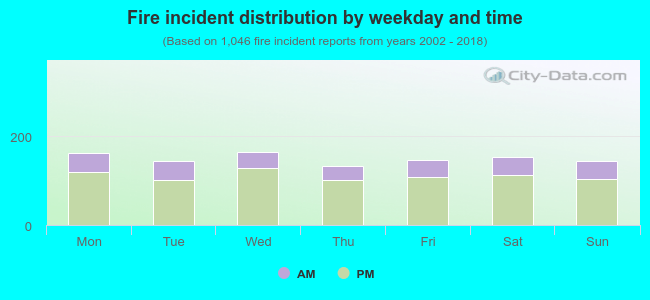 25.9% incidents where reported in the morning and 74.1% in the evening. The most fires (15.8%) took place on Wednesday, and the least (12.7%) on Thursday.
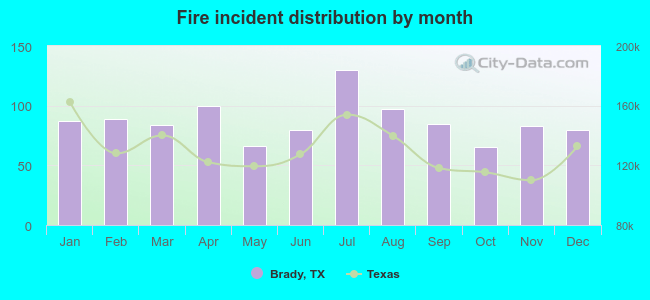 Based on the 1,046 incident reports from years 2002 - 2018 most fires (12.4%) took place during July, and the least (6.2%) in October.
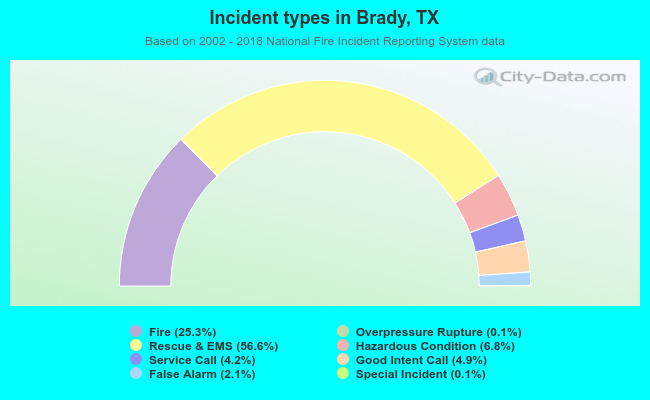 Out of all 4,136 cases reported during the years 2002 - 2018, the most belonged to the categories: Rescue & EMS (56.6%), Fire (25.3%), and Hazardous Condition (6.8%).
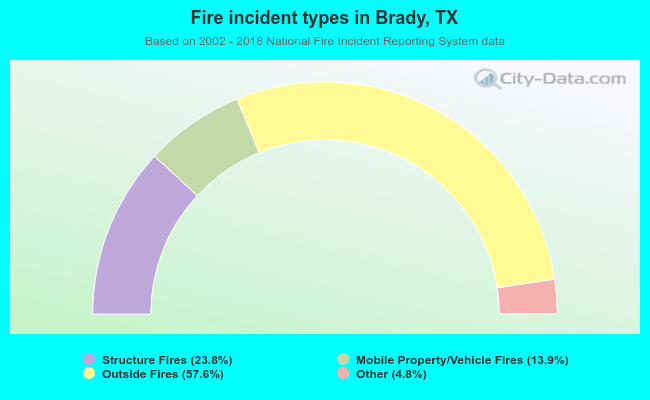 When looking into fire subcategories, the most incidents belonged to: Outside Fires (57.6%), and Structure Fires (23.8%).