Kerrville: Fire Incidents, Texas (TX)
Where are fire incidents reported in Kerrville, TX
Something went wrong! Please refresh the page.
| Fire incidents reported | |
|---|---|
| Sreet name | Count |
| INTERSTATE 10 | 94 |
| JUNCTION HWY | 84 |
| IH 10 | 64 |
| SIDNEY BAKER | 60 |
| I-10 | 42 |
| HARPER RD | 40 |
| LOOP 534 | 34 |
| MEMORIAL BLVD | 34 |
| BANDERA HWY | 32 |
| HWY 27 | 32 |
| RANCHERO RD | 30 |
| GOAT CREEK RD | 22 |
| I10 | 22 |
| JUNCTION HWY | 22 |
| SINGING WIND DR | 22 |
| WATER ST | 22 |
| CAMINO REAL | 20 |
| MEDINA HWY | 20 |
| GOAT CREEK ROAD | 18 |
| SIDNEY BAKER ST | 18 |
| STADIUM DR | 18 |
| CYPRESS CREEK RD | 16 |
| FREDERICKSBURG RD | 16 |
| LEGION DR | 16 |
| THOMPSON DR | 16 |
| UPPER TURTLE CREEK RD | 16 |
| GABE RD | 14 |
| HWY 173 | 14 |
| LOWER TURTLE CREEK RD | 14 |
| OLYMPIC DR | 14 |
| Other | 1,214 |
2002 - 2018 National Fire Incident Reporting System (NFIRS) incidents
- Incident types reported to NFIRS in Kerrville, TX
- 38,94686.2%Rescue & EMS
- 2,1004.6%Fire
- 1,5173.4%Hazardous Condition
- 9562.1%Good Intent Call
- 9512.1%False Alarm
- 5941.3%Service Call
- 790.2%Special Incident
- Fire incident types reported to NFIRS in Kerrville, TX
- 1,20957.6%Outside Fires
- 51224.4%Structure Fires
- 31615.0%Mobile Property/Vehicle Fires
- 633.0%Other
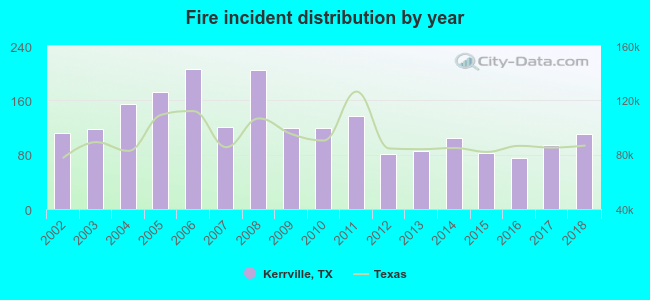 Based on the data from the years 2002 - 2018 the average number of fire incidents per year is 124. The highest number of fire incidents - 206 took place in 2006, and the least - 75 in 2016. The data has a declining trend.
The average number of yearly fire incidents per 10k residents in Kerrville, TX compared to nearest cities:
(Note: Based on data for the last 3 years, including only cities with population 5,000 and above)
| Kerrville: | 40.7 |
| Fredericksburg: | 122.8 |
| Boerne: | 118.2 |
| Lakehills: | 36.2 |
| Fair Oaks Ranch: | 18.3 |
| Helotes: | 33.9 |
| Hondo: | 2.8 |
| Leon Valley: | 37.2 |
| Canyon Lake: | 56.0 |
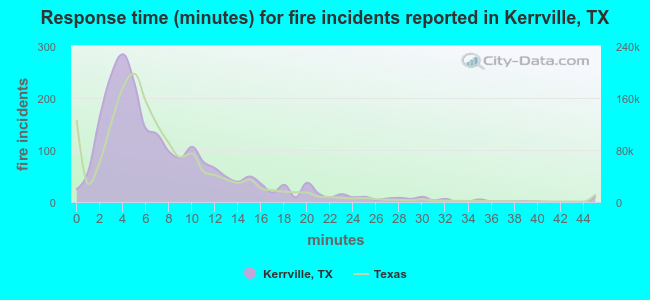 The median response time based on all reported fire incidents is 6 minutes. This is close to the Texas median value.
The median response time in Kerrville, TX compared to nearest cities:
(Note: Based on data for all years, including only cities with at least 500 fire incidents)
| Kerrville: | 6 minutes |
| Comfort: | 12 minutes |
| Fredericksburg: | 11 minutes |
| Boerne: | 11 minutes |
| Helotes: | 7 minutes |
| Blanco: | 11 minutes |
| Bulverde: | 9 minutes |
| Castroville: | 10 minutes |
| Canyon Lake: | 9 minutes |
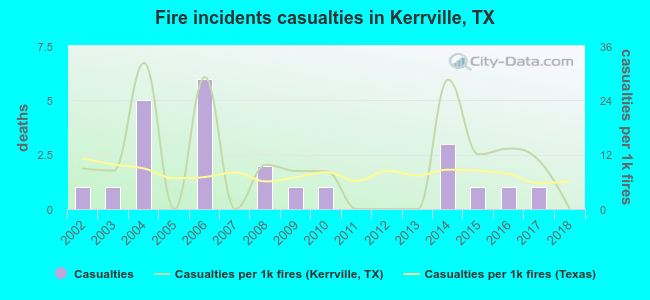 According to the reports from the years 2002 - 2018 the average number of fire-related yearly casualties is 1. The highest number of casualties - 6 took place in 2006, and the lowest - 0 in 2005. The data has a decreasing trend.
The average number of casualties per 1,000 fire incidents is 10. This indicator was the highest - 32 in 2004, and the lowest 0 in 2005. The trend for injuries per 1,000 incidents is dropping. Compared to the Texas value the number of injuries per 1,000 fire incidents is higher.
According to the reports from the years 2002 - 2018 the average number of fire-related yearly casualties is 1. The highest number of casualties - 6 took place in 2006, and the lowest - 0 in 2005. The data has a decreasing trend.
The average number of casualties per 1,000 fire incidents is 10. This indicator was the highest - 32 in 2004, and the lowest 0 in 2005. The trend for injuries per 1,000 incidents is dropping. Compared to the Texas value the number of injuries per 1,000 fire incidents is higher.Casualties per 1,000 incidents in Kerrville, TX compared to nearest cities:
(Note: Based on data for all years, including only cities with at least 500 fire incidents)
| Kerrville: | 11.0 |
| Comfort: | 0.0 |
| Fredericksburg: | 0.0 |
| Boerne: | 9.6 |
| Helotes: | 22.4 |
| Blanco: | 1.2 |
| Bulverde: | 0.0 |
| Castroville: | 1.4 |
| Canyon Lake: | 2.2 |
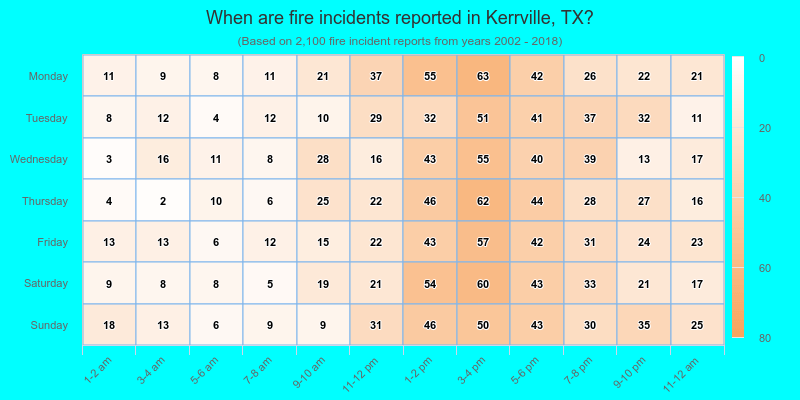
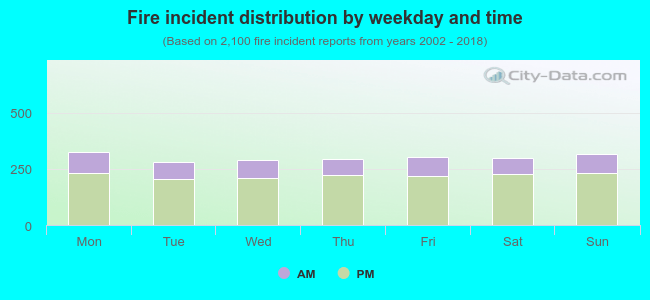 26.7% incidents where reported in the morning and 73.3% in the evening. The most fires (15.5%) took place on Monday, and the least (13.3%) on Tuesday.
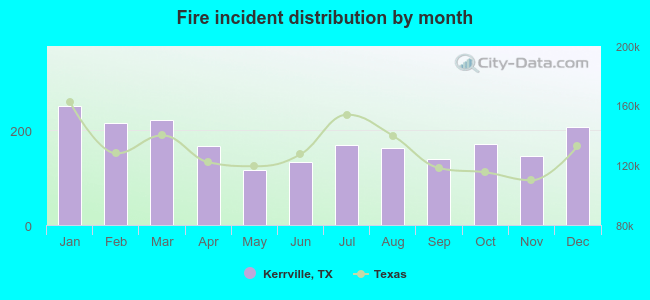 Based on the 2,100 reports from years 2002 - 2018 most fires (12.0%) took place during January, and the least (5.6%) in May.
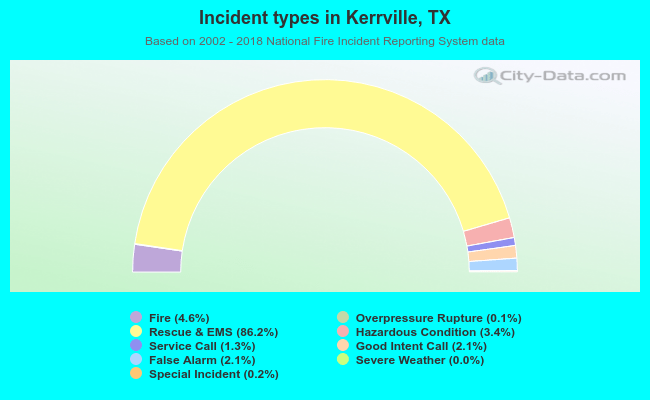 Out of all 45,180 cases reported during the years 2002 - 2018, the most belonged to the categories: Rescue & EMS (86.2%), Fire (4.6%), and Hazardous Condition (3.4%).
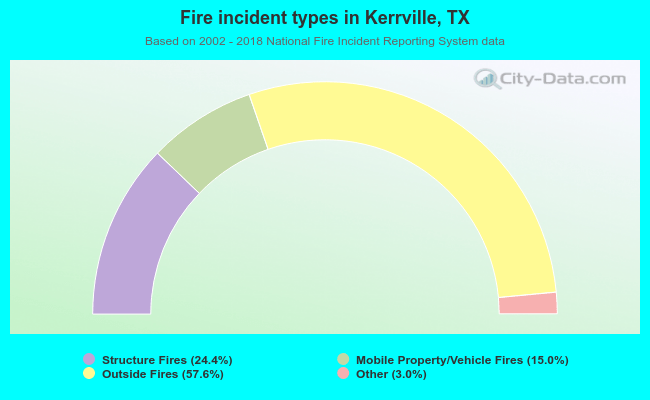 When looking into fire subcategories, the most incidents belonged to: Outside Fires (57.6%), and Structure Fires (24.4%).