Brandon: Fire Incidents, Mississippi (MS)
Where are fire incidents reported in Brandon, MS
Something went wrong! Please refresh the page.
| Fire incidents reported | |
|---|---|
| Sreet name | Count |
| GOVERNMENT ST | 114 |
| W GOVERNMENT ST | 88 |
| I 20 | 82 |
| HWY 471 | 66 |
| HIGHWAY 471 | 62 |
| HWY 43 | 56 |
| I 20 W | 56 |
| SPILLWAY RD | 56 |
| SHELL OIL RD | 52 |
| STAR RD | 46 |
| HIGHWAY 18 | 44 |
| HWY 18 | 42 |
| SHILOH RD | 42 |
| HWY 25 | 40 |
| ANDREW CHAPEL RD | 38 |
| OLD FANNIN RD | 36 |
| I 20 E | 34 |
| SUNSET DR | 34 |
| GRANTS FERRY RD | 32 |
| W JASPER ST | 32 |
| FANNIN LANDING CIR | 30 |
| SHILOH RD | 30 |
| LAKE HARBOR RD | 28 |
| PISGAH RD | 28 |
| TRICKHAMBRIDGE RD | 26 |
| W SUNSET DR | 26 |
| 25 HWY | 24 |
| 471 HWY | 24 |
| BRAGG ST | 24 |
| BURNHAM RD | 24 |
| Other | 3,293 |
2003 - 2018 National Fire Incident Reporting System (NFIRS) incidents
- Incident types reported to NFIRS in Brandon, MS
- 16,38558.0%Rescue & EMS
- 4,60916.3%Fire
- 2,1967.8%Service Call
- 1,7206.1%Good Intent Call
- 1,5865.6%Hazardous Condition
- 1,5385.4%False Alarm
- 1320.5%Severe Weather
- 450.2%Overpressure Rupture
- 390.1%Special Incident
- Fire incident types reported to NFIRS in Brandon, MS
- 2,34050.8%Outside Fires
- 1,44031.2%Structure Fires
- 55011.9%Mobile Property/Vehicle Fires
- 2796.1%Other
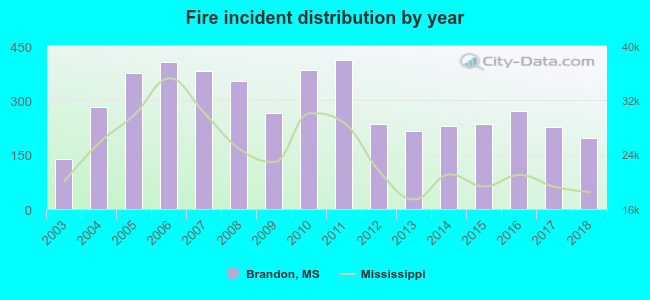 Based on the data from the years 2003 - 2018 the average number of fire incidents per year is 288. The highest number of fire incidents - 412 took place in 2011, and the least - 137 in 2003. The data has a growing trend.
The average number of yearly fire incidents per 10k residents in Brandon, MS compared to nearest cities:
(Note: Based on data for the last 3 years, including only cities with population 5,000 and above)
| Brandon: | 99.6 |
| Pearl: | 32.7 |
| Flowood: | 56.9 |
| Richland: | 54.7 |
| Ridgeland: | 34.4 |
| Jackson: | 25.9 |
| Madison: | 40.1 |
| Byram: | 51.3 |
| Clinton: | 27.8 |
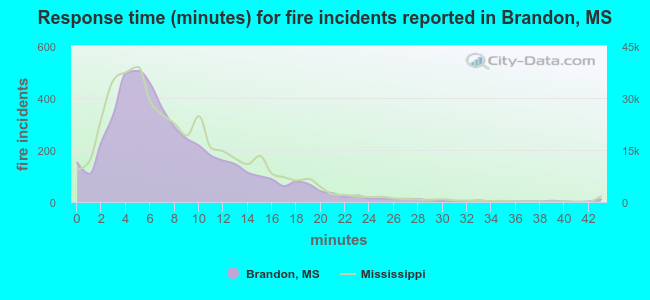 The median response time based on all reported fire incidents is 7 minutes. This is comparable to the state median value.
The median response time in Brandon, MS compared to nearest cities:
(Note: Based on data for all years, including only cities with at least 500 fire incidents)
| Brandon: | 7 minutes |
| Pearl: | 4 minutes |
| Flowood: | 4 minutes |
| Richland: | 3 minutes |
| Florence: | 9 minutes |
| Pelahatchie: | 10 minutes |
| Ridgeland: | 4 minutes |
| Jackson: | 5 minutes |
| Madison: | 5 minutes |
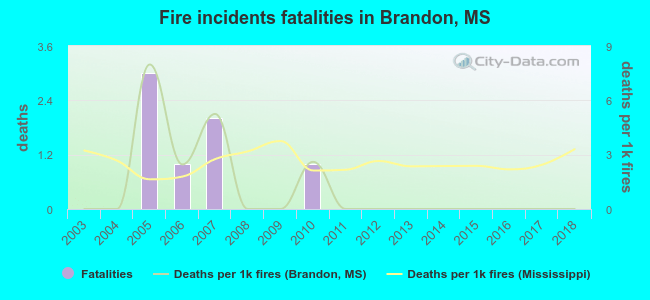 Based on the data from the years 2003 - 2018 the average number of fire-related fatalities per year is 0. The highest number of deaths - 3 took place in 2005, and the lowest - 0 in 2003. The data has a constant trend.
The average number of deaths per 1,000 fire incidents is 1. This indicator was the highest - 8 in 2005, and the lowest 0 in 2003. The trend for deaths per 1,000 incidents is constant. Compared to the Mississippi value the number of fatalities per 1,000 fires is lower.
Based on the data from the years 2003 - 2018 the average number of fire-related fatalities per year is 0. The highest number of deaths - 3 took place in 2005, and the lowest - 0 in 2003. The data has a constant trend.
The average number of deaths per 1,000 fire incidents is 1. This indicator was the highest - 8 in 2005, and the lowest 0 in 2003. The trend for deaths per 1,000 incidents is constant. Compared to the Mississippi value the number of fatalities per 1,000 fires is lower.Deaths per 1,000 incidents in Brandon, MS compared to nearest cities:
(Note: Based on data for all years, including only cities with at least 2,500 fire incidents)
| Brandon: | 1.5 |
| Jackson: | 2.1 |
| Canton: | 1.2 |
| Carthage: | 1.9 |
| Vicksburg: | 4.2 |
| Brookhaven: | 0.3 |
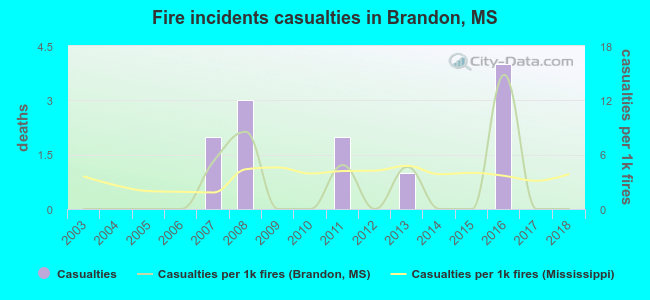 According to the reports from the years 2003 - 2018 the average number of fire-related yearly casualties is 1. The highest number of reported injuries - 4 took place in 2016, and the lowest - 0 in 2003. The data has a constant trend.
The average number of casualties per 1,000 fires is 2. This indicator was the highest - 15 in 2016, and the lowest 0 in 2003. The trend for injuries per 1,000 incidents is constant. Compared to the Mississippi value the number of injuries per 1,000 fire incidents is lower.
According to the reports from the years 2003 - 2018 the average number of fire-related yearly casualties is 1. The highest number of reported injuries - 4 took place in 2016, and the lowest - 0 in 2003. The data has a constant trend.
The average number of casualties per 1,000 fires is 2. This indicator was the highest - 15 in 2016, and the lowest 0 in 2003. The trend for injuries per 1,000 incidents is constant. Compared to the Mississippi value the number of injuries per 1,000 fire incidents is lower.
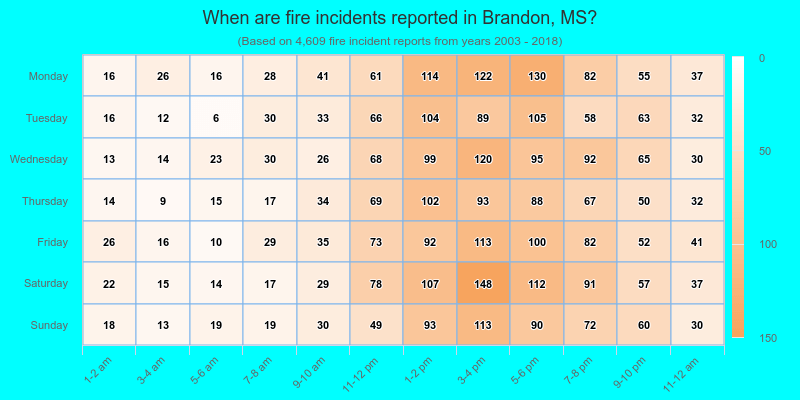
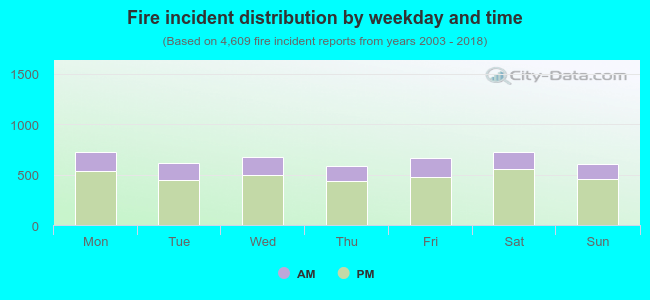 25.9% incidents where reported in the morning and 74.1% in the evening. The most fires (15.8%) took place on Monday, and the least (12.8%) on Thursday.
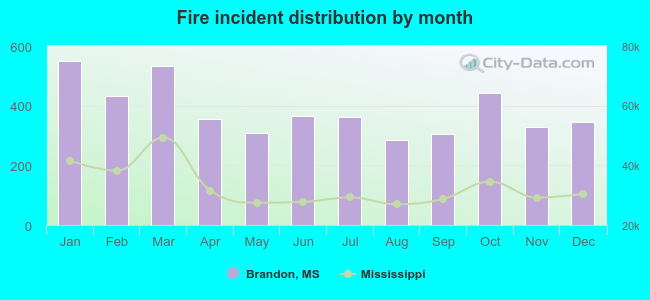 According to the 4,609 fires from years 2003 - 2018 most fires (11.9%) took place during January, and the least (6.2%) in August.
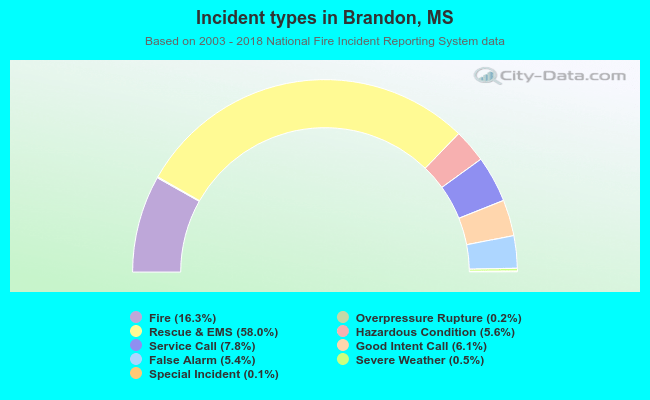 Out of all 28,250 cases reported during the years 2003 - 2018, the most belonged to the categories: Rescue & EMS (58.0%), Fire (16.3%), and Service Call (7.8%).
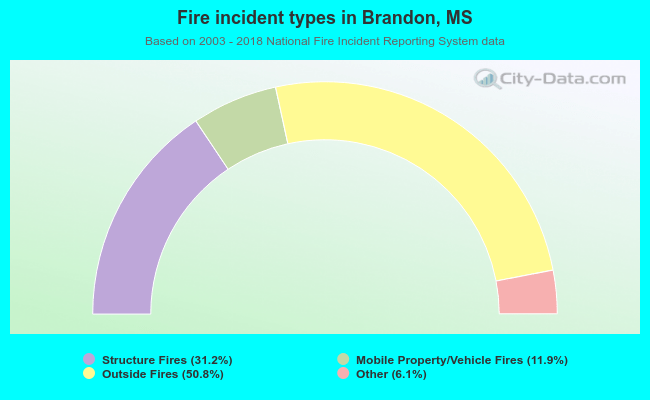 When looking into fire subcategories, the most incidents belonged to: Outside Fires (50.8%), and Structure Fires (31.2%).