Richland: Fire Incidents, Mississippi (MS)
Where are fire incidents reported in Richland, MS
Something went wrong! Please refresh the page.
|
| |||||||||||||||||||||||||||||||||||||||||||||||||||||||||||||||||||||||||||||||||||||||||||||||||||||||||||||
| Other | 297 | |||||||||||||||||||||||||||||||||||||||||||||||||||||||||||||||||||||||||||||||||||||||||||||||||||||||||||||
2003 - 2018 National Fire Incident Reporting System (NFIRS) incidents
- Incident types reported to NFIRS in Richland, MS
- 3,21472.2%Rescue & EMS
- 59313.3%Fire
- 3016.8%Hazardous Condition
- 1653.7%Service Call
- 952.1%False Alarm
- 631.4%Good Intent Call
- 140.3%Overpressure Rupture
- Fire incident types reported to NFIRS in Richland, MS
- 30952.1%Outside Fires
- 13622.9%Structure Fires
- 11619.6%Mobile Property/Vehicle Fires
- 325.4%Other
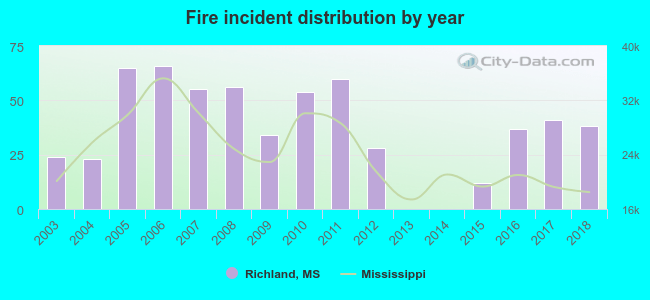 Based on the data from the years 2003 - 2018 the average number of fire incidents per year is 37. The highest number of reported fires - 66 took place in 2006, and the least - 0 in 2013. The data has an increasing trend.
The average number of yearly fire incidents per 10k residents in Richland, MS compared to nearest cities:
(Note: Based on data for the last 3 years, including only cities with population 5,000 and above)
| Richland: | 54.7 |
| Pearl: | 32.7 |
| Flowood: | 56.9 |
| Jackson: | 25.9 |
| Byram: | 51.3 |
| Brandon: | 99.6 |
| Clinton: | 27.8 |
| Ridgeland: | 34.4 |
| Madison: | 40.1 |
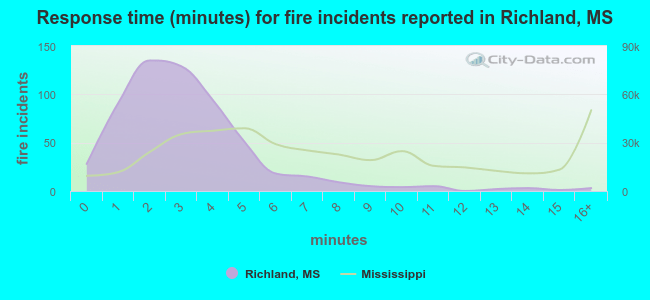 The median response time based on all reported fire incidents is 3 minutes. This is much lower than the state median value.
The median response time in Richland, MS compared to nearest cities:
(Note: Based on data for all years, including only cities with at least 500 fire incidents)
| Richland: | 3 minutes |
| Pearl: | 4 minutes |
| Florence: | 9 minutes |
| Flowood: | 4 minutes |
| Jackson: | 5 minutes |
| Byram: | 5 minutes |
| Brandon: | 7 minutes |
| Terry: | 8 minutes |
| Clinton: | 5 minutes |
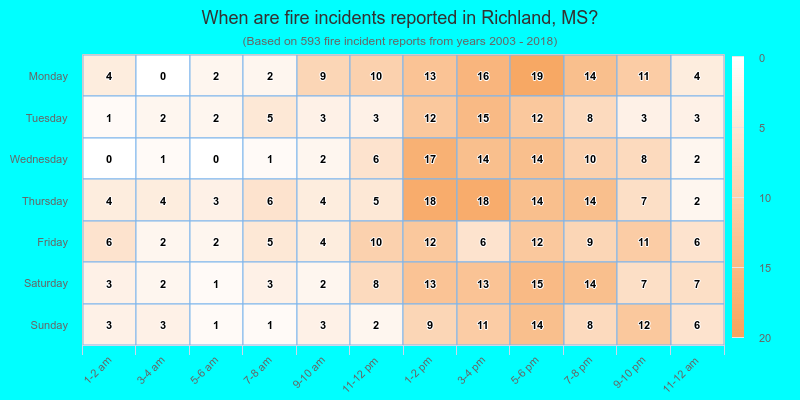
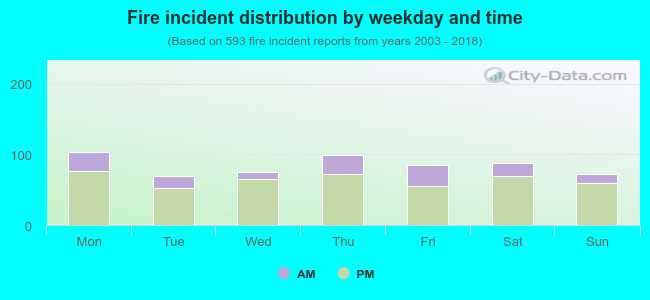 23.6% incidents where reported in the morning and 76.4% in the evening. The most fires (17.5%) took place on Monday, and the least (11.6%) on Tuesday.
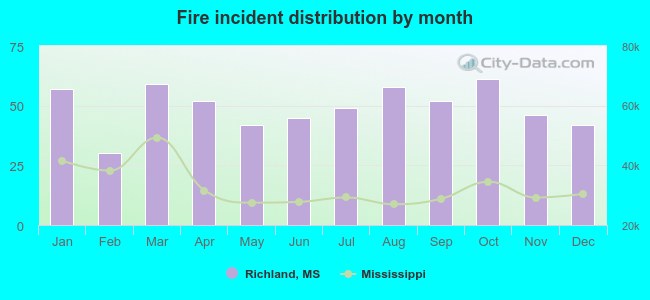 According to the 593 incident reports from years 2003 - 2018 most fires (10.3%) took place during October, and the least (5.1%) in February.
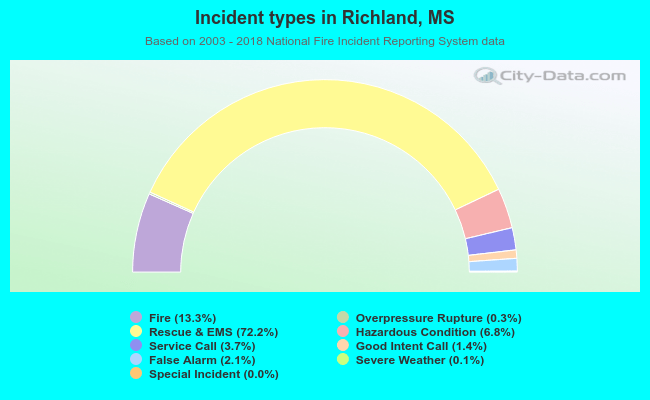 Out of all 4,450 cases reported during the years 2003 - 2018, the most belonged to the categories: Rescue & EMS (72.2%), Fire (13.3%), and Hazardous Condition (6.8%).
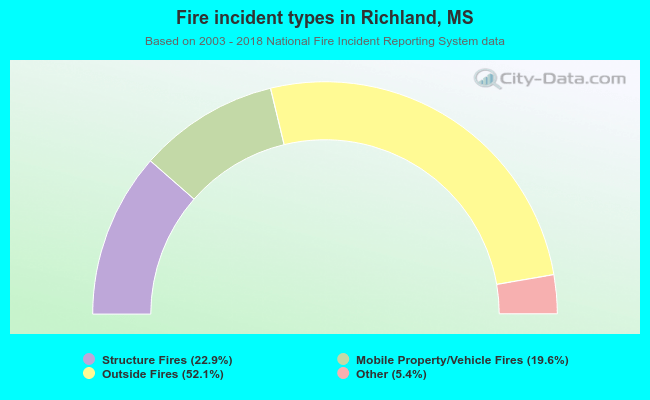 When looking into fire subcategories, the most reports belonged to: Outside Fires (52.1%), and Structure Fires (22.9%).