Brewton: Fire Incidents, Alabama (AL)
Where are fire incidents reported in Brewton, AL
Something went wrong! Please refresh the page.
|
| |||||||||||||||||||||||||||||||||||||||||||||||||||||||||||||||||||||||||||||||||||||||||||||||||||||||||||||
2003 - 2018 National Fire Incident Reporting System (NFIRS) incidents
- Incident types reported to NFIRS in Brewton, AL
- 2,88847.2%Rescue & EMS
- 1,14618.7%Fire
- 1,09517.9%Hazardous Condition
- 4948.1%Service Call
- 2413.9%False Alarm
- 1843.0%Good Intent Call
- 440.7%Special Incident
- 260.4%Severe Weather
- Fire incident types reported to NFIRS in Brewton, AL
- 59251.7%Outside Fires
- 31427.4%Structure Fires
- 13611.9%Mobile Property/Vehicle Fires
- 1049.1%Other
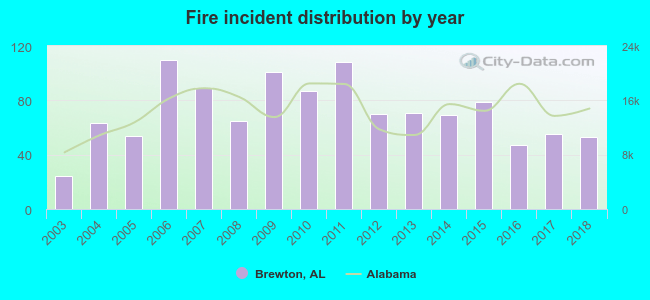 According to the data from the years 2003 - 2018 the average number of fire incidents per year is 72. The highest number of fire incidents - 110 took place in 2006, and the least - 24 in 2003. The data has a growing trend.
The average number of yearly fire incidents per 10k residents in Brewton, AL compared to nearest cities:
(Note: Based on data for the last 3 years, including only cities with population 5,000 and above)
| Brewton: | 95.8 |
| Atmore: | 99.3 |
| Monroeville: | 51.7 |
| Andalusia: | 19.1 |
| Stockton: | 3.9 |
| Bay Minette: | 70.7 |
 The median response time based on all reported fire incidents is 5 minutes. This is lower than the state median value.
The median response time in Brewton, AL compared to nearest cities:
(Note: Based on data for all years, including only cities with at least 500 fire incidents)
| Brewton: | 5 minutes |
| Evergreen: | 10 minutes |
| Atmore: | 4 minutes |
| Bay Minette: | 5 minutes |
 According to the data from the years 2003 - 2018 the average number of fire-related fatalities per year is 0. The highest number of deaths - 2 took place in 2017, and the lowest - 0 in 2004. The data has a declining trend.
 28.5% incidents where reported in the morning and 71.5% in the evening. The most fires (22.0%) took place on Monday, and the least (7.6%) on Saturday.
 According to the 1,146 fire incidents from years 2003 - 2018 most fires (15.4%) took place during March, and the least (6.2%) in August.
 Out of all 6,124 cases reported during the years 2003 - 2018, the most belonged to the categories: Rescue & EMS (47.2%), Fire (18.7%), and Hazardous Condition (17.9%).
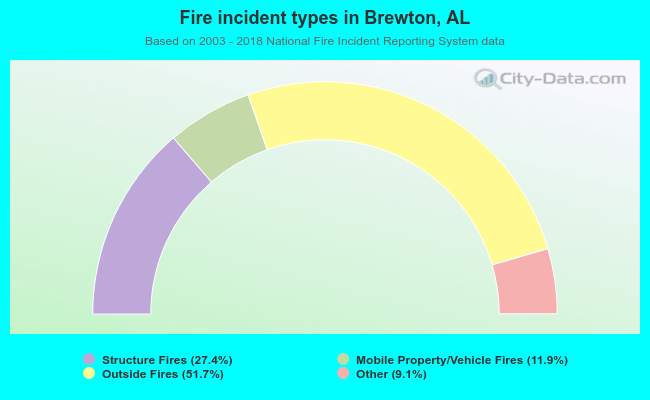 When looking into fire subcategories, the most incidents belonged to: Outside Fires (51.7%), and Structure Fires (27.4%).