Andalusia: Fire Incidents, Alabama (AL)
Where are fire incidents reported in Andalusia, AL
Something went wrong! Please refresh the page.
|
| |||||||||||||||||||||||||||||||||||||||||||||||||||||||||||||||||||||||||||||||||||||||||||||||||||||||||||||
2003 - 2018 National Fire Incident Reporting System (NFIRS) incidents
- Incident types reported to NFIRS in Andalusia, AL
- 15646.7%Fire
- 5115.3%Service Call
- 3610.8%Rescue & EMS
- 3510.5%Hazardous Condition
- 309.0%Good Intent Call
- 103.0%False Alarm
- 92.7%Severe Weather
- 61.8%Special Incident
- 10.3%Overpressure Rupture
- Fire incident types reported to NFIRS in Andalusia, AL
- 8554.5%Outside Fires
- 5132.7%Structure Fires
- 106.4%Mobile Property/Vehicle Fires
- 106.4%Other
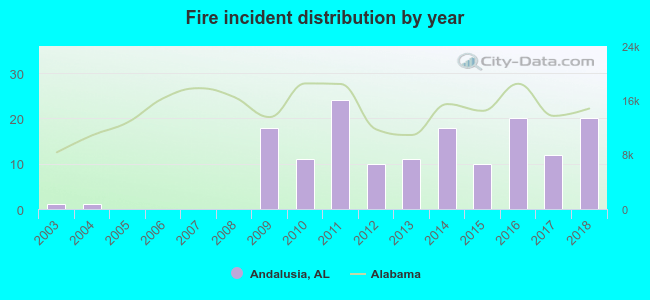 Based on the data from the years 2003 - 2018 the average number of fire incidents per year is 10. The highest number of reported fires - 24 took place in 2011, and the least - 0 in 2005. The data has an increasing trend.
The average number of yearly fire incidents per 10k residents in Andalusia, AL compared to nearest cities:
(Note: Based on data for the last 3 years, including only cities with population 5,000 and above)
| Andalusia: | 19.1 |
| Opp: | 85.9 |
| Greenville: | 81.8 |
| Brewton: | 95.8 |
| Enterprise: | 34.8 |
| Daleville: | 16.9 |
| Troy: | 51.4 |
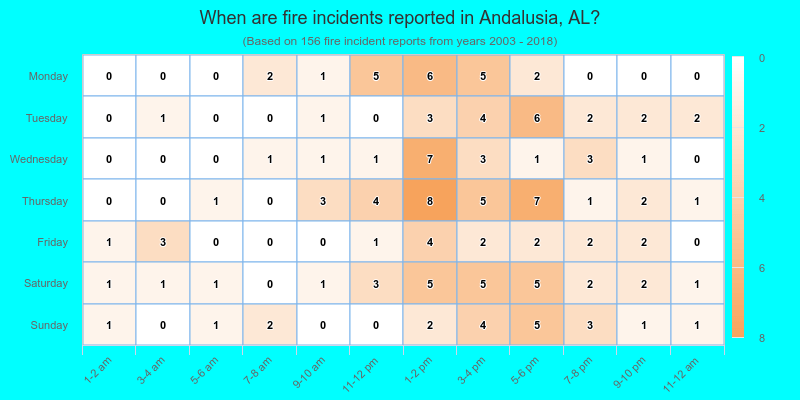
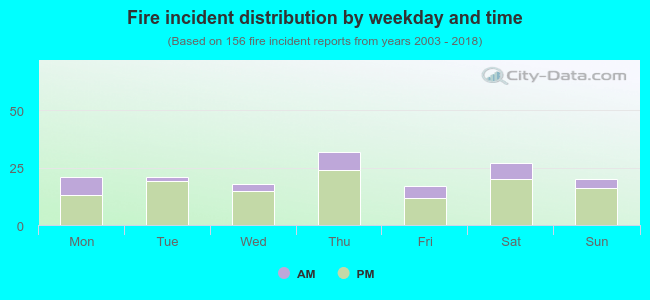 23.7% incidents where reported in the morning and 76.3% in the evening. The most fires (20.5%) took place on Thursday, and the least (10.9%) on Friday.
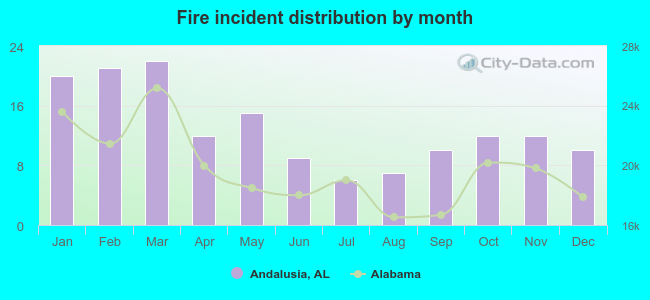 According to the 156 fire incidents from years 2003 - 2018 most fires (14.1%) took place during March, and the least (3.8%) in July.
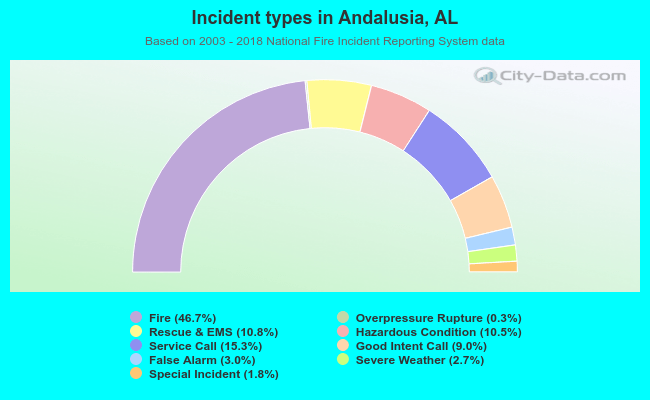 Out of all 334 cases reported during the years 2003 - 2018, the most belonged to the categories: Fire (46.7%), Service Call (15.3%), and Rescue & EMS (10.8%).
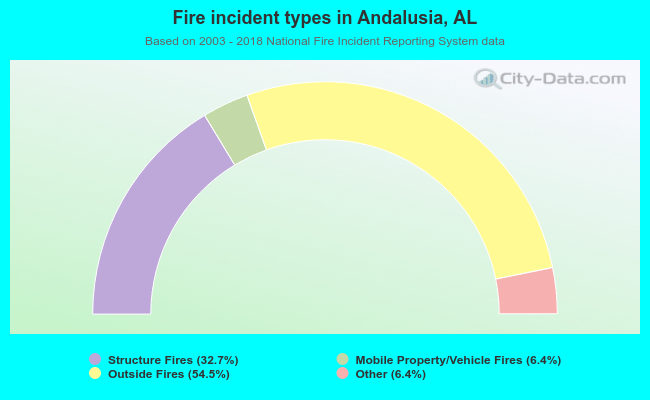 When looking into fire subcategories, the most incidents belonged to: Outside Fires (54.5%), and Structure Fires (32.7%).