Broken Bow: Fire Incidents, Oklahoma (OK)
Where are fire incidents reported in Broken Bow, OK
Something went wrong! Please refresh the page.
|
| |||||||||||||||||||||||||||||||||||||||||||||||||||||||||||||||||||||||||||||||||||||||||||||||||||||||||||||
| Other | 946 | |||||||||||||||||||||||||||||||||||||||||||||||||||||||||||||||||||||||||||||||||||||||||||||||||||||||||||||
2003 - 2018 National Fire Incident Reporting System (NFIRS) incidents
- Incident types reported to NFIRS in Broken Bow, OK
- 1,27870.1%Fire
- 35719.6%Rescue & EMS
- 874.8%Hazardous Condition
- 422.3%Good Intent Call
- 402.2%Service Call
- 80.4%False Alarm
- 50.3%Severe Weather
- 50.3%Special Incident
- Fire incident types reported to NFIRS in Broken Bow, OK
- 60447.3%Outside Fires
- 49138.4%Structure Fires
- 15912.4%Mobile Property/Vehicle Fires
- 241.9%Other
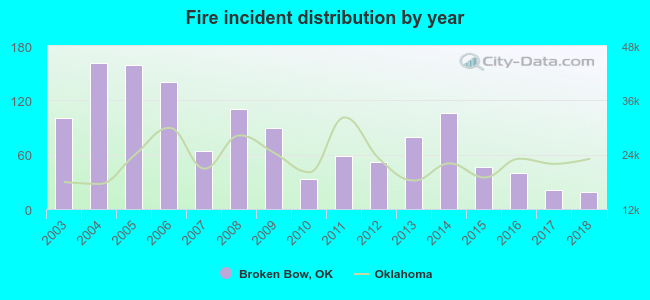 According to the data from the years 2003 - 2018 the average number of fires per year is 80. The highest number of reported fire incidents - 161 took place in 2004, and the least - 19 in 2018. The data has a dropping trend.
 The median response time based on all reported fire incidents is 7 minutes. This is about the same as the Oklahoma median value.
The median response time in Broken Bow, OK compared to nearest cities:
(Note: Based on data for all years, including only cities with at least 500 fire incidents)
| Broken Bow: | 7 minutes |
| Idabel: | 5 minutes |
| Ashdown: | 7 minutes |
| Hugo: | 5 minutes |
| Mena: | 6 minutes |
| Nashville: | 7 minutes |
| Antlers: | 8 minutes |
| Talihina: | 12 minutes |
| Texarkana: | 5 minutes |
 Based on the data from the years 2003 - 2018 the average number of fire-related fatalities per year is 0. The highest number of deaths - 3 took place in 2005, and the lowest - 0 in 2004. The data has a dropping trend.
 29.0% incidents where reported in the morning and 71.0% in the evening. The most fires (15.5%) took place on Saturday, and the least (13.1%) on Friday.
 Based on the 1,278 fires from years 2003 - 2018 most fires (13.0%) took place during January, and the least (5.5%) in November.
 Out of all 1,823 cases reported during the years 2003 - 2018, the most belonged to the categories: Fire (70.1%), Rescue & EMS (19.6%), and Hazardous Condition (4.8%).
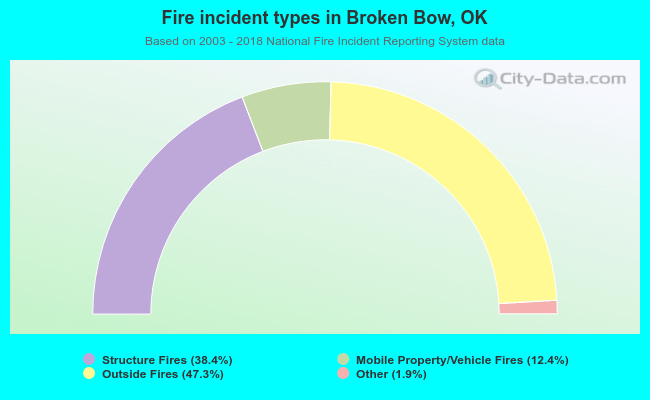 When looking into fire subcategories, the most reports belonged to: Outside Fires (47.3%), and Structure Fires (38.4%).