California: Fire Incidents, Maryland (MD)
Where are fire incidents reported in California, MD
Something went wrong! Please refresh the page.
| Fire incidents reported | |
|---|---|
| Sreet name | Count |
| THREE NOTCH RD | 352 |
| MACARTHUR BLVD | 128 |
| ST ANDREWS CHURCH RD | 70 |
| WORTH AVE | 68 |
| PATUXENT BEACH RD | 64 |
| LAUREL GLEN RD | 36 |
| MIRAMAR WAY | 34 |
| TOWN CREEK DR | 30 |
| CHANCELLORS RUN RD | 26 |
| FIRST COLONY WAY | 26 |
| IVERSON DR | 24 |
| MILLSTONE LANDING RD | 22 |
| OLD ROLLING RD | 20 |
| SAINT ANDREWS CHURCH RD | 20 |
| CHURCH DR | 18 |
| INDIAN BRIDGE RD | 18 |
| SHADY MILE DR | 18 |
| WOODSTOWN WAY | 18 |
| CLARKS RD | 16 |
| FIRST COLONY BLVD | 16 |
| KINGSTON CREEK RD | 16 |
| MYRTLE POINT RD | 16 |
| AUDREY WAY | 14 |
| MILITARY LA | 14 |
| SYCAMORE LA | 14 |
| WILDEWOOD PKY | 14 |
| AIRPORT RD | 12 |
| ALTON LN | 12 |
| BILL DIXON RD | 12 |
| KING WAY | 12 |
2002 - 2018 National Fire Incident Reporting System (NFIRS) incidents
- Incident types reported to NFIRS in California, MD
- 1,74228.2%Good Intent Call
- 1,25020.2%Rescue & EMS
- 1,15518.7%Fire
- 98315.9%Hazardous Condition
- 66210.7%False Alarm
- 2764.5%Service Call
- 811.3%Severe Weather
- 230.4%Special Incident
- 120.2%Overpressure Rupture
- Fire incident types reported to NFIRS in California, MD
- 59151.2%Structure Fires
- 37932.8%Outside Fires
- 11710.1%Mobile Property/Vehicle Fires
- 685.9%Other
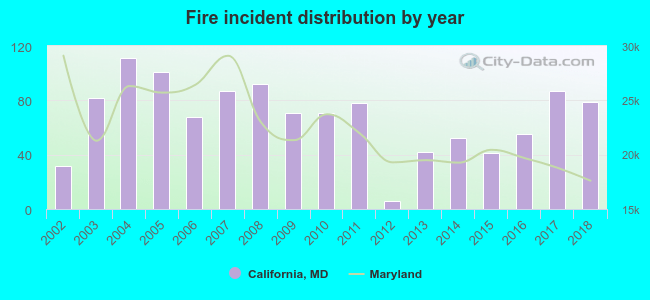 Based on the data from the years 2002 - 2018 the average number of fires per year is 68. The highest number of reported fires - 111 took place in 2004, and the least - 6 in 2012. The data has a rising trend.
The average number of yearly fire incidents per 10k residents in California, MD compared to nearest cities:
(Note: Based on data for the last 3 years, including only cities with population 5,000 and above)
| California: | 62.1 |
| Lexington Park: | 105.2 |
| Chesapeake Beach: | 28.4 |
| Cambridge: | 103.4 |
| La Plata: | 161.3 |
| Waldorf: | 63.0 |
| Brandywine: | 86.3 |
| Shady Side: | 6.9 |
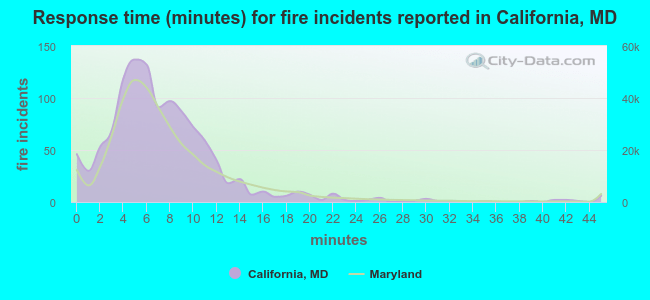 The median response time based on all reported fire incidents is 6 minutes. This is about the same as the Maryland median value.
The median response time in California, MD compared to nearest cities:
(Note: Based on data for all years, including only cities with at least 500 fire incidents)
| California: | 6 minutes |
| Solomons: | 9 minutes |
| Lexington Park: | 6 minutes |
| Lusby: | 8 minutes |
| Leonardtown: | 8 minutes |
| Mechanicsville: | 10 minutes |
| Prince Frederick: | 6 minutes |
| Charlotte Hall: | 10 minutes |
| Hughesville: | 7 minutes |
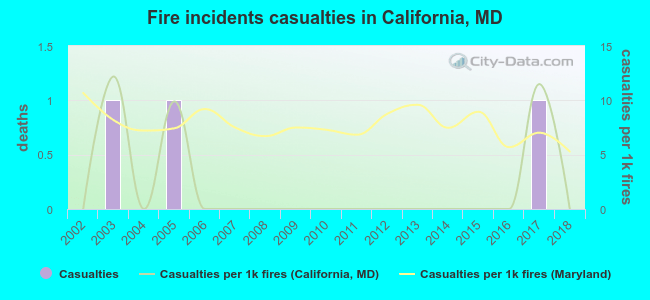 Based on the reports from the years 2002 - 2018 the average number of fire-related casualties per year is 0. The highest number of reported casualties - 1 took place in 2003, and the lowest - 0 in 2002. The data has a constant trend.
The average number of injuries per 1,000 fire incidents is 2. This indicator was the highest - 12 in 2003, and the lowest 0 in 2002. The trend for casualties per 1,000 incidents is constant. Compared to the Maryland value the number of casualties per 1,000 fire incidents is much lower.
Based on the reports from the years 2002 - 2018 the average number of fire-related casualties per year is 0. The highest number of reported casualties - 1 took place in 2003, and the lowest - 0 in 2002. The data has a constant trend.
The average number of injuries per 1,000 fire incidents is 2. This indicator was the highest - 12 in 2003, and the lowest 0 in 2002. The trend for casualties per 1,000 incidents is constant. Compared to the Maryland value the number of casualties per 1,000 fire incidents is much lower.Casualties per 1,000 incidents in California, MD compared to nearest cities:
(Note: Based on data for all years, including only cities with at least 500 fire incidents)
| California: | 2.6 |
| Solomons: | 1.9 |
| Lexington Park: | 11.9 |
| Lusby: | 0.0 |
| Leonardtown: | 1.6 |
| Mechanicsville: | 0.8 |
| Prince Frederick: | 1.9 |
| Charlotte Hall: | 0.0 |
| Hughesville: | 5.4 |
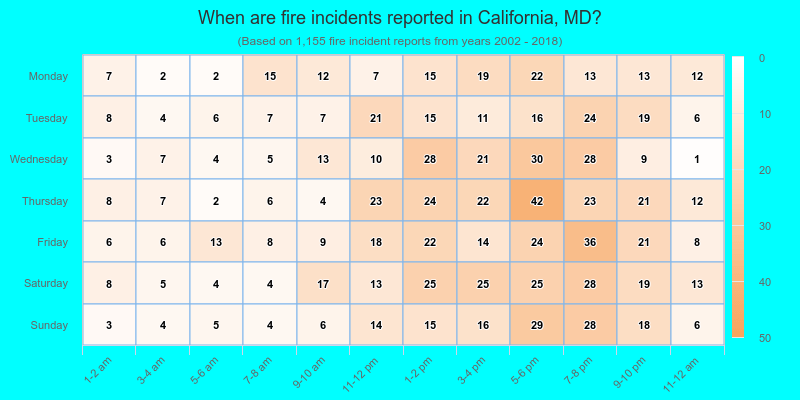
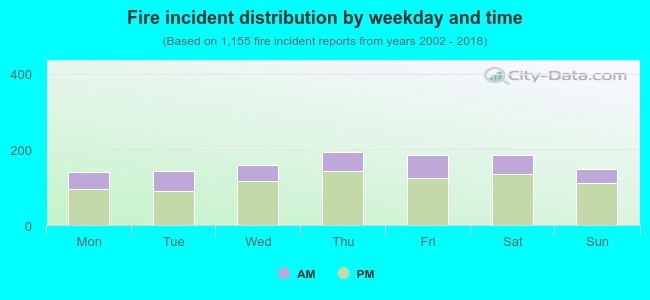 29.2% incidents where reported in the morning and 70.8% in the evening. The most fires (16.8%) took place on Thursday, and the least (12.0%) on Monday.
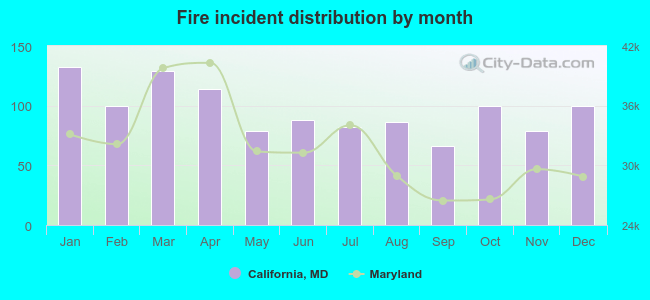 Based on the 1,155 reports from years 2002 - 2018 most fires (11.4%) took place during January, and the least (5.7%) in September.
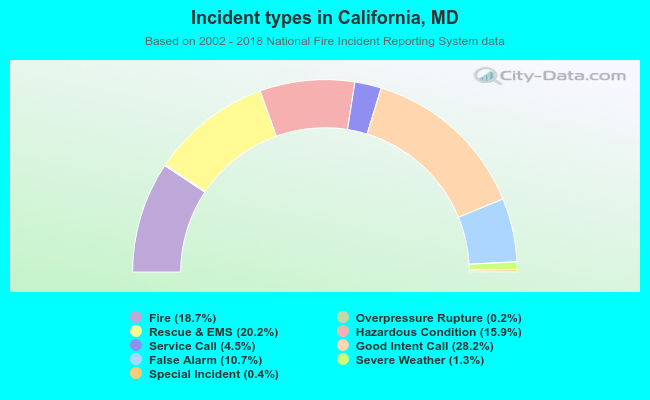 Out of all 6,184 cases reported during the years 2002 - 2018, the most belonged to the categories: Good Intent Call (28.2%), Rescue & EMS (20.2%), and Fire (18.7%).
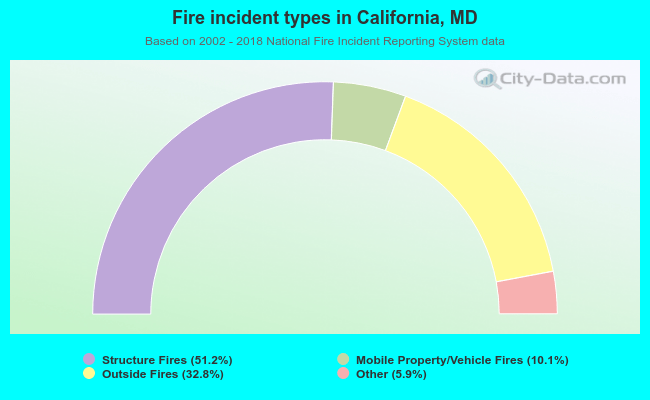 When looking into fire subcategories, the most incidents belonged to: Structure Fires (51.2%), and Outside Fires (32.8%).