Lexington Park: Fire Incidents, Maryland (MD)
Where are fire incidents reported in Lexington Park, MD
Something went wrong! Please refresh the page.
| Fire incidents reported | |
|---|---|
| Sreet name | Count |
| GREAT MILLS RD | 394 |
| THREE NOTCH RD | 370 |
| VALLEY CT | 98 |
| PEGG RD | 92 |
| LIBERTY ST | 88 |
| HERMANVILLE RD | 78 |
| ESSEX DR | 68 |
| POINT LOOKOUT RD | 62 |
| MIDWAY DR | 48 |
| HILTON DR | 46 |
| LINCOLN AVE | 46 |
| ROGERS DR | 44 |
| VALLEY ESTATES DR | 42 |
| SUE DR | 36 |
| JOE BAKER CT | 32 |
| COLUMBUS DR | 30 |
| CASTAWAY CIR | 28 |
| FDR BLVD | 28 |
| LYNN DR | 28 |
| FLOWER DR | 26 |
| SHANGRI-LA DR | 26 |
| SHANGRILA DR | 26 |
| WILLOWS RD | 26 |
| BUNKER HILL DR | 24 |
| LEXWOODS CT | 24 |
| PEGG LA | 24 |
| POPLAR RIDGE RD | 24 |
| TREETOP RD | 24 |
| MAYFAIRE LA | 22 |
| TULAGI PL | 22 |
| Other | 265 |
2002 - 2018 National Fire Incident Reporting System (NFIRS) incidents
- Incident types reported to NFIRS in Lexington Park, MD
- 2,19126.2%Fire
- 1,72220.6%Good Intent Call
- 1,69620.3%Rescue & EMS
- 1,56218.7%Hazardous Condition
- 6317.6%False Alarm
- 4595.5%Service Call
- 500.6%Severe Weather
- 190.2%Special Incident
- 180.2%Overpressure Rupture
- Fire incident types reported to NFIRS in Lexington Park, MD
- 1,21355.4%Structure Fires
- 71032.4%Outside Fires
- 1677.6%Mobile Property/Vehicle Fires
- 1014.6%Other
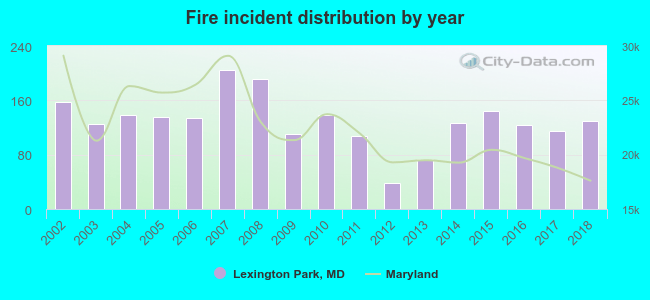 Based on the data from the years 2002 - 2018 the average number of fire incidents per year is 129. The highest number of reported fires - 204 took place in 2007, and the least - 38 in 2012. The data has a declining trend.
The average number of yearly fire incidents per 10k residents in Lexington Park, MD compared to nearest cities:
(Note: Based on data for the last 3 years, including only cities with population 5,000 and above)
| Lexington Park: | 105.2 |
| California: | 62.1 |
| Cambridge: | 103.4 |
| Chesapeake Beach: | 28.4 |
| La Plata: | 161.3 |
| Waldorf: | 63.0 |
| Brandywine: | 86.3 |
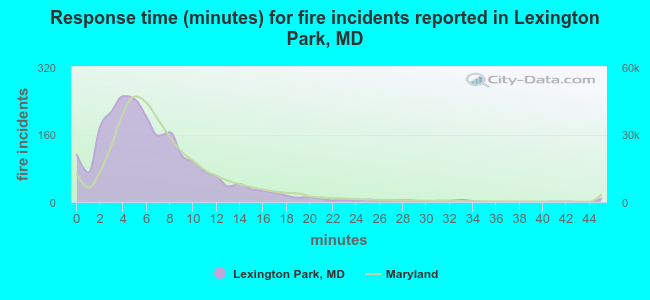 The median response time based on all reported fire incidents is 6 minutes. This is comparable to the Maryland median value.
The median response time in Lexington Park, MD compared to nearest cities:
(Note: Based on data for all years, including only cities with at least 500 fire incidents)
| Lexington Park: | 6 minutes |
| California: | 6 minutes |
| Solomons: | 9 minutes |
| Lusby: | 8 minutes |
| Leonardtown: | 8 minutes |
| Mechanicsville: | 10 minutes |
| Prince Frederick: | 6 minutes |
| Charlotte Hall: | 10 minutes |
| Hughesville: | 7 minutes |
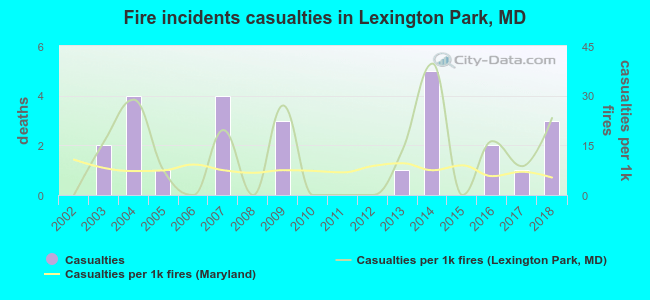 Based on the data from the years 2002 - 2018 the average number of fire-related casualties per year is 2. The highest number of casualties - 5 took place in 2014, and the lowest - 0 in 2002. The data has an increasing trend.
The average number of injuries per 1,000 fire incidents is 12. This indicator was the highest - 40 in 2014, and the lowest 0 in 2002. The trend for casualties per 1,000 incidents is growing. Compared to the state value the number of injuries per 1,000 fire incidents is higher.
Based on the data from the years 2002 - 2018 the average number of fire-related casualties per year is 2. The highest number of casualties - 5 took place in 2014, and the lowest - 0 in 2002. The data has an increasing trend.
The average number of injuries per 1,000 fire incidents is 12. This indicator was the highest - 40 in 2014, and the lowest 0 in 2002. The trend for casualties per 1,000 incidents is growing. Compared to the state value the number of injuries per 1,000 fire incidents is higher.Casualties per 1,000 incidents in Lexington Park, MD compared to nearest cities:
(Note: Based on data for all years, including only cities with at least 500 fire incidents)
| Lexington Park: | 11.9 |
| California: | 2.6 |
| Solomons: | 1.9 |
| Lusby: | 0.0 |
| Leonardtown: | 1.6 |
| Mechanicsville: | 0.8 |
| Prince Frederick: | 1.9 |
| Charlotte Hall: | 0.0 |
| Hughesville: | 5.4 |
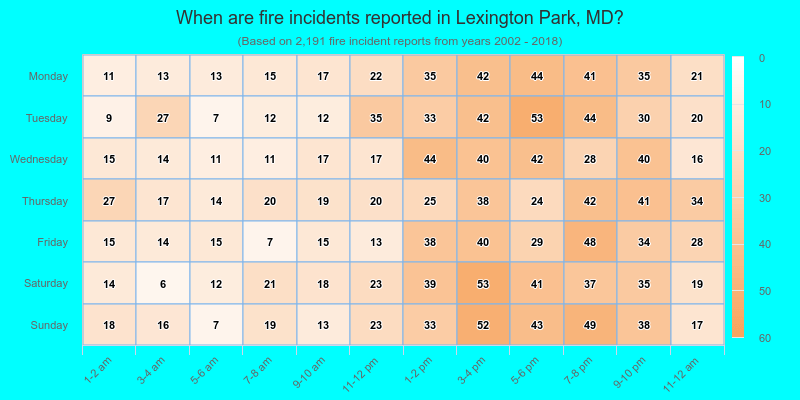
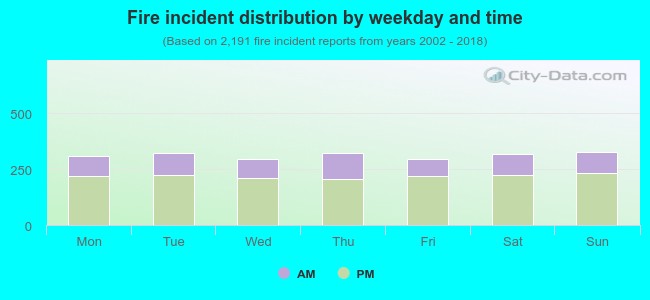 30.3% incidents where reported in the morning and 69.7% in the evening. The most fires (15.0%) took place on Sunday, and the least (13.5%) on Wednesday.
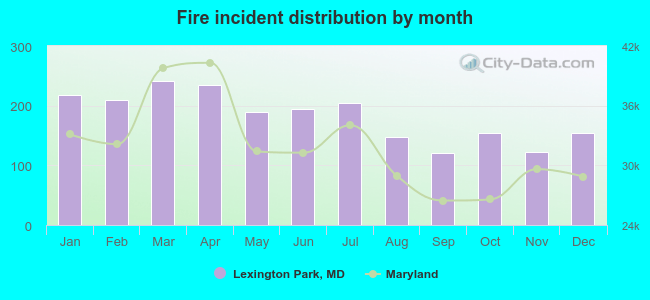 According to the 2,191 fires from years 2002 - 2018 most fires (11.0%) took place during March, and the least (5.5%) in September.
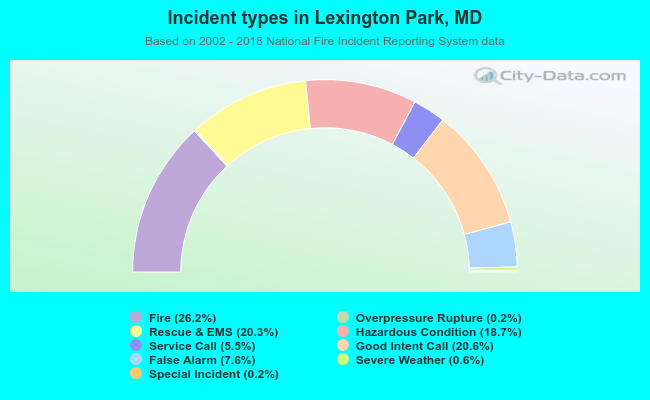 Out of all 8,348 cases reported during the years 2002 - 2018, the most belonged to the categories: Fire (26.2%), Good Intent Call (20.6%), and Rescue & EMS (20.3%).
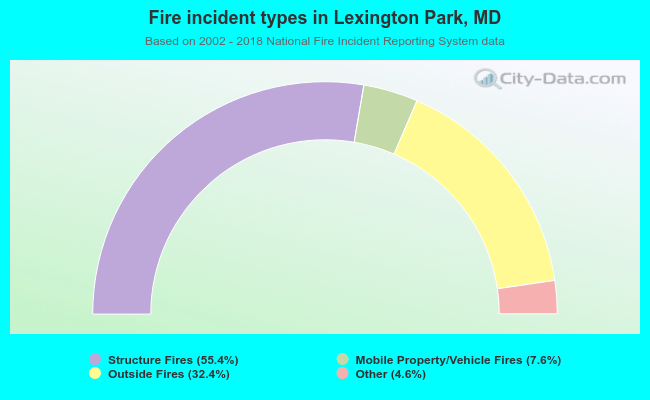 When looking into fire subcategories, the most incidents belonged to: Structure Fires (55.4%), and Outside Fires (32.4%).