Cayce: Fire Incidents, South Carolina (SC)
Where are fire incidents reported in Cayce, SC
Something went wrong! Please refresh the page.
| Fire incidents reported | |
|---|---|
| Sreet name | Count |
| CHARLESTON HWY | 142 |
| AIRPORT BLVD | 66 |
| I26 | 46 |
| I77 | 44 |
| STATE ST | 36 |
| NEW STATE RD | 34 |
| FRINK ST | 32 |
| HOLLAND AVE | 30 |
| KNOX ABBOTT DRS | 30 |
| TAYLOR RD | 30 |
| 12TH ST | 28 |
| KNOX ABBOTT DR | 28 |
| NAPLES AVE | 28 |
| POPLAR ST | 26 |
| DUNBAR RD | 24 |
| WILKINSON ST | 24 |
| INTERSTATE 77 | 20 |
| FOREMAN ST | 18 |
| MEMORIAL DR | 18 |
| SPENCER PL | 18 |
| HUDSON AVE | 16 |
| INTERSTATE 26 FWY | 16 |
| LAFAYETTE AVE | 16 |
| CONGAREE DR | 14 |
| DIXIANA RD | 14 |
| I-77 HWY | 14 |
| JAMES ST | 14 |
| JULIUS FELDER ST | 14 |
| LEXINGTON AVE | 14 |
| TAYLOR ST | 14 |
| Other | 78 |
2003 - 2018 National Fire Incident Reporting System (NFIRS) incidents
- Incident types reported to NFIRS in Cayce, SC
- 2,18239.5%Rescue & EMS
- 94617.1%Fire
- 70812.8%Service Call
- 66612.0%Hazardous Condition
- 61011.0%Good Intent Call
- 3907.1%False Alarm
- 200.4%Overpressure Rupture
- 60.1%Severe Weather
- Fire incident types reported to NFIRS in Cayce, SC
- 34236.2%Structure Fires
- 32534.4%Outside Fires
- 27028.5%Mobile Property/Vehicle Fires
- 91.0%Other
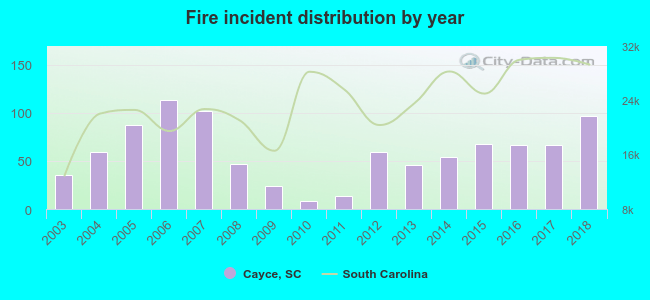 According to the data from the years 2003 - 2018 the average number of fires per year is 59. The highest number of fires - 113 took place in 2006, and the least - 8 in 2010. The data has an increasing trend.
The average number of yearly fire incidents per 10k residents in Cayce, SC compared to nearest cities:
(Note: Based on data for the last 3 years, including only cities with population 5,000 and above)
| Cayce: | 59.5 |
| West Columbia: | 246.6 |
| Oak Grove: | 1.0 |
| Columbia: | 115.1 |
| Forest Acres: | 5.2 |
| Lexington: | 285.2 |
| Irmo: | 83.5 |
| Hopkins: | 127.9 |
| Lugoff: | 130.0 |
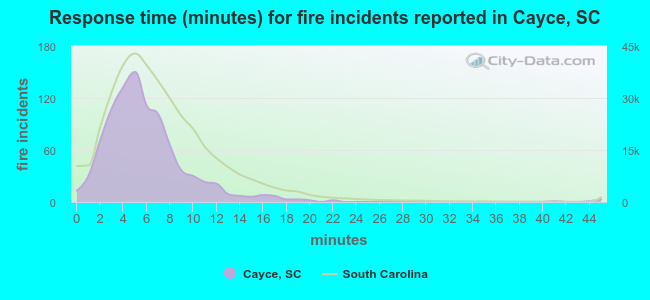 The median response time based on all reported fire incidents is 5 minutes. This is lower than the South Carolina median value.
The median response time in Cayce, SC compared to nearest cities:
(Note: Based on data for all years, including only cities with at least 500 fire incidents)
| Cayce: | 5 minutes |
| West Columbia: | 6 minutes |
| Columbia: | 7 minutes |
| Lexington: | 7 minutes |
| Gaston: | 8 minutes |
| Irmo: | 8 minutes |
| Hopkins: | 9 minutes |
| Swansea: | 8 minutes |
| Pelion: | 8 minutes |
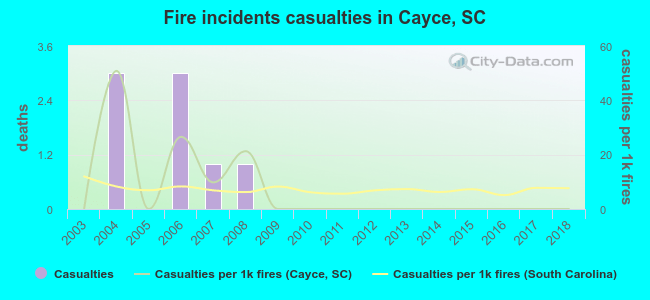 Based on the data from the years 2003 - 2018 the average number of fire-related casualties per year is 1. The highest number of reported injuries - 3 took place in 2004, and the lowest - 0 in 2003. The data has a constant trend.
The average number of casualties per 1,000 fires is 7. This indicator was the highest - 51 in 2004, and the lowest 0 in 2003. The trend for casualties per 1,000 fires is constant. Compared to the state value the number of injuries per 1,000 fires is about the same.
Based on the data from the years 2003 - 2018 the average number of fire-related casualties per year is 1. The highest number of reported injuries - 3 took place in 2004, and the lowest - 0 in 2003. The data has a constant trend.
The average number of casualties per 1,000 fires is 7. This indicator was the highest - 51 in 2004, and the lowest 0 in 2003. The trend for casualties per 1,000 fires is constant. Compared to the state value the number of injuries per 1,000 fires is about the same.
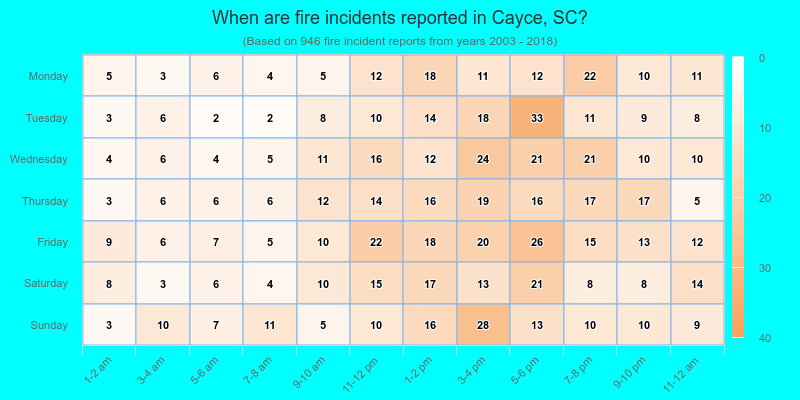
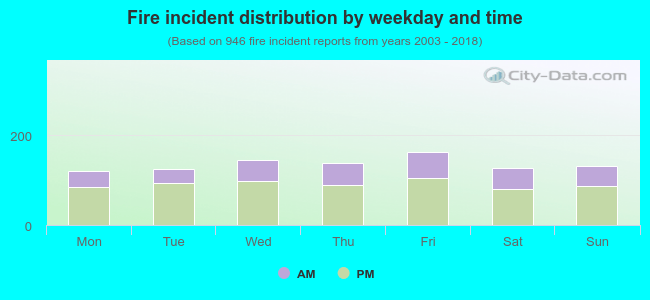 32.8% incidents where reported in the morning and 67.2% in the evening. The most fires (17.2%) took place on Friday, and the least (12.6%) on Monday.
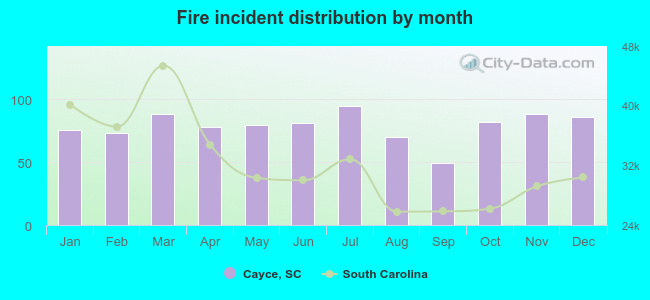 According to the 946 reports from years 2003 - 2018 most fires (10.0%) took place during July, and the least (5.2%) in September.
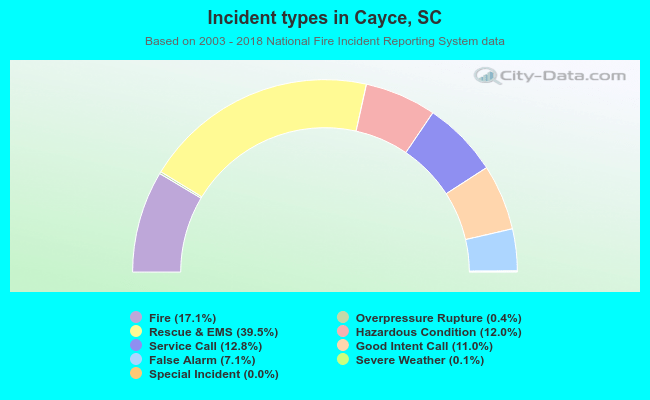 Out of all 5,530 cases reported during the years 2003 - 2018, the most belonged to the categories: Rescue & EMS (39.5%), Fire (17.1%), and Service Call (12.8%).
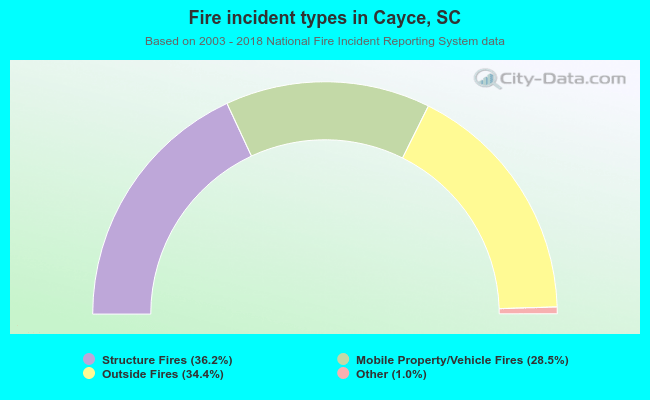 When looking into fire subcategories, the most reports belonged to: Structure Fires (36.2%), and Outside Fires (34.4%).