Lexington: Fire Incidents, South Carolina (SC)
Where are fire incidents reported in Lexington, SC
Something went wrong! Please refresh the page.
| Fire incidents reported | |
|---|---|
| Sreet name | Count |
| INTERSTATE 20 FWY | 324 |
| SUNSET BLVD | 274 |
| TWO NOTCH RD | 238 |
| PLATT SPRINGS RD | 226 |
| SOUTH LAKE DR | 226 |
| AUGUSTA RD | 208 |
| OLD ORANGEBURG RD | 164 |
| LAKE DR | 158 |
| EDMUND HWY | 148 |
| CALKS FERRY RD | 124 |
| OLD CHEROKEE RD | 122 |
| MAIN ST | 112 |
| BOILING SPRINGS RD | 108 |
| AUGUSTA HWY | 92 |
| CRYSTAL SPRINGS DR | 90 |
| FOUNDERS RD | 90 |
| OLD CHAPIN RD | 88 |
| 20 | 84 |
| MINERAL SPRINGS RD | 84 |
| OLD BARNWELL RD | 84 |
| NORTH LAKE DR | 72 |
| NAZARETH RD | 66 |
| 20 E | 64 |
| CORLEY MILL RD | 64 |
| LONGS POND RD | 62 |
| OAK DR | 62 |
| BLUEFIELD RD | 56 |
| POND BRANCH RD | 54 |
| WINDY WOOD RD | 54 |
| DOE TRAIL DR | 52 |
| Other | 2,229 |
2004 - 2018 National Fire Incident Reporting System (NFIRS) incidents
- Incident types reported to NFIRS in Lexington, SC
- 10,36739.0%Rescue & EMS
- 5,87922.1%Fire
- 3,25912.3%Service Call
- 2,4839.4%Good Intent Call
- 2,2688.5%False Alarm
- 2,1418.1%Hazardous Condition
- 810.3%Severe Weather
- 560.2%Overpressure Rupture
- Fire incident types reported to NFIRS in Lexington, SC
- 3,26055.5%Outside Fires
- 1,75729.9%Structure Fires
- 84914.4%Mobile Property/Vehicle Fires
- 130.2%Other
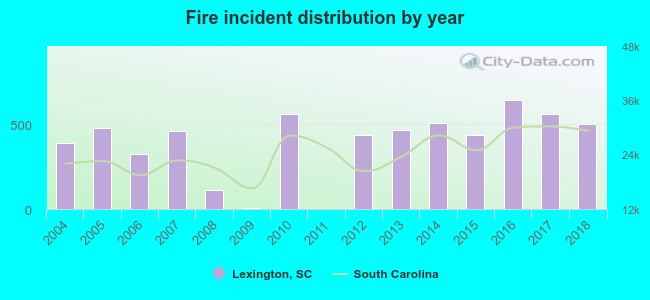 According to the data from the years 2004 - 2018 the average number of fire incidents per year is 392. The highest number of reported fires - 640 took place in 2016, and the least - 2 in 2011. The data has an increasing trend.
The average number of yearly fire incidents per 10k residents in Lexington, SC compared to nearest cities:
(Note: Based on data for the last 3 years, including only cities with population 5,000 and above)
| Lexington: | 285.2 |
| Oak Grove: | 1.0 |
| Irmo: | 83.5 |
| West Columbia: | 246.6 |
| Cayce: | 59.5 |
| Columbia: | 115.1 |
| Forest Acres: | 5.2 |
| Hopkins: | 127.9 |
| Newberry: | 88.9 |
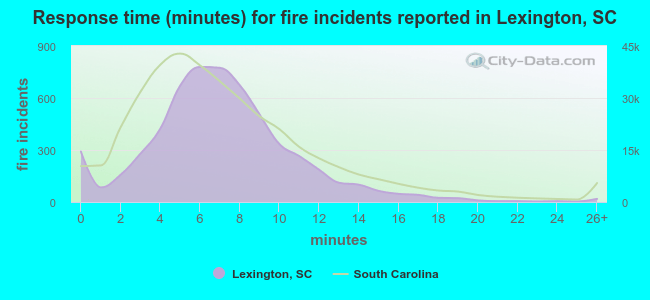 The median response time based on all reported fire incidents is 7 minutes. This is about the same as the South Carolina median value.
The median response time in Lexington, SC compared to nearest cities:
(Note: Based on data for all years, including only cities with at least 500 fire incidents)
| Lexington: | 7 minutes |
| Irmo: | 8 minutes |
| West Columbia: | 6 minutes |
| Cayce: | 5 minutes |
| Gilbert: | 8 minutes |
| Columbia: | 7 minutes |
| Gaston: | 8 minutes |
| Chapin: | 8 minutes |
| Pelion: | 8 minutes |
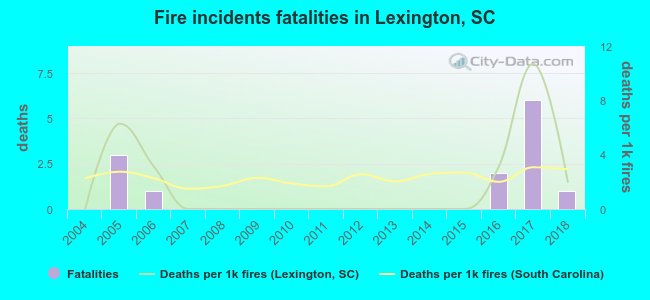 Based on the reports from the years 2004 - 2018 the average number of fire-related fatalities per year is 1. The highest number of deaths - 6 took place in 2017, and the lowest - 0 in 2004. The data has a rising trend.
The average number of fatalities per 1,000 fire incidents is 2. This indicator was the highest - 11 in 2017, and the lowest 0 in 2004. The trend for fatalities per 1,000 fire incidents is increasing. Compared to the state value the number of fatalities per 1,000 fire incidents is about the same.
Based on the reports from the years 2004 - 2018 the average number of fire-related fatalities per year is 1. The highest number of deaths - 6 took place in 2017, and the lowest - 0 in 2004. The data has a rising trend.
The average number of fatalities per 1,000 fire incidents is 2. This indicator was the highest - 11 in 2017, and the lowest 0 in 2004. The trend for fatalities per 1,000 fire incidents is increasing. Compared to the state value the number of fatalities per 1,000 fire incidents is about the same.Deaths per 1,000 incidents in Lexington, SC compared to nearest cities:
(Note: Based on data for all years, including only cities with at least 2,500 fire incidents)
| Lexington: | 2.2 |
| West Columbia: | 1.9 |
| Columbia: | 2.8 |
| Gaston: | 3.1 |
| Orangeburg: | 2.0 |
| Aiken: | 2.2 |
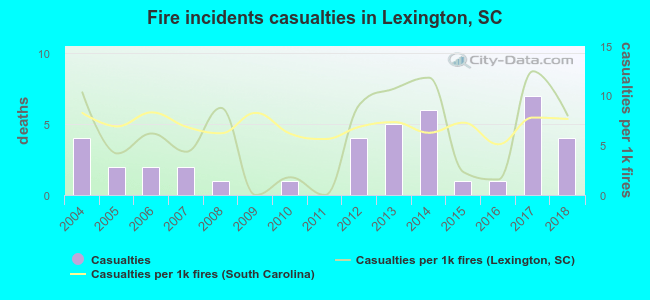 According to the reports from the years 2004 - 2018 the average number of fire-related casualties per year is 3. The highest number of reported casualties - 7 took place in 2017, and the lowest - 0 in 2009. The data has a constant trend.
The average number of casualties per 1,000 fires is 6. This indicator was the highest - 12 in 2017, and the lowest 0 in 2009. The trend for injuries per 1,000 incidents is dropping. Compared to the South Carolina value the number of injuries per 1,000 incidents is similar.
According to the reports from the years 2004 - 2018 the average number of fire-related casualties per year is 3. The highest number of reported casualties - 7 took place in 2017, and the lowest - 0 in 2009. The data has a constant trend.
The average number of casualties per 1,000 fires is 6. This indicator was the highest - 12 in 2017, and the lowest 0 in 2009. The trend for injuries per 1,000 incidents is dropping. Compared to the South Carolina value the number of injuries per 1,000 incidents is similar.
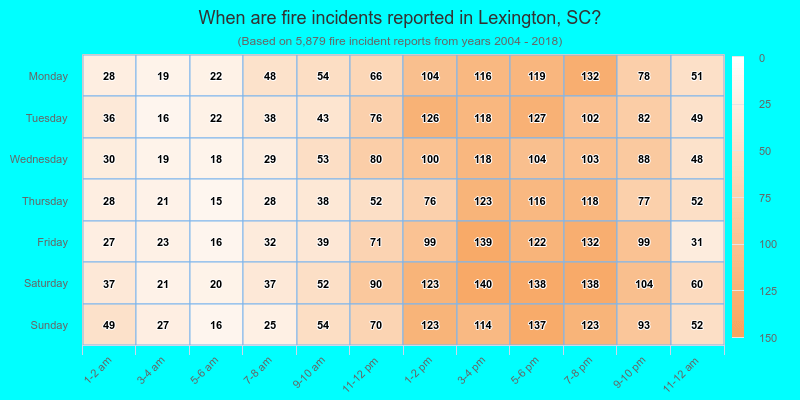
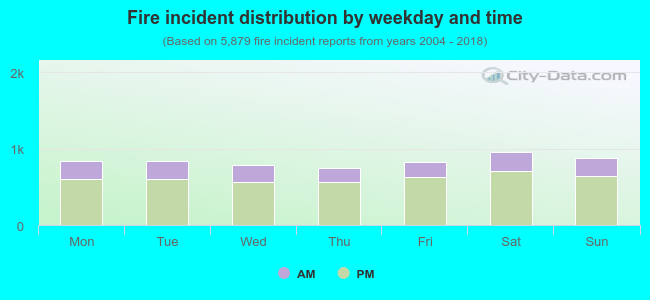 27.0% incidents where reported in the morning and 73.0% in the evening. The most fires (16.3%) took place on Saturday, and the least (12.7%) on Thursday.
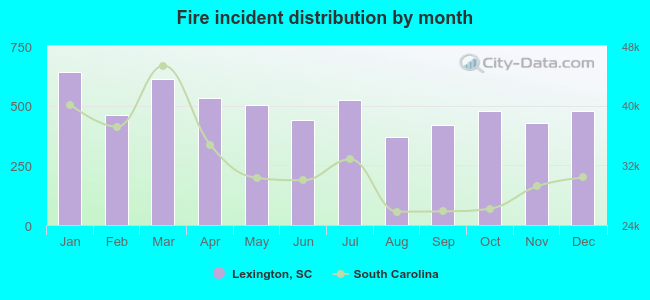 According to the 5,879 fires from years 2004 - 2018 most fires (10.9%) took place during January, and the least (6.3%) in August.
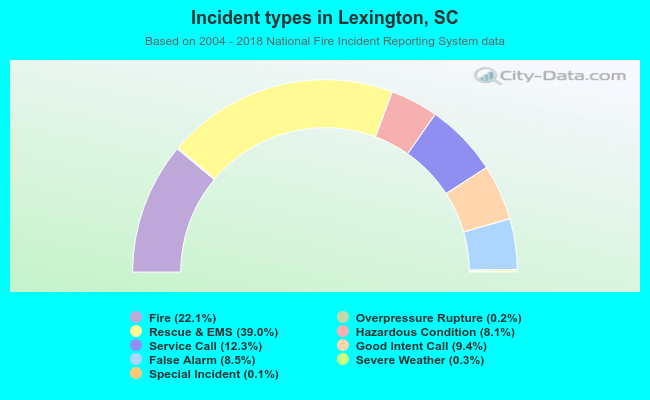 Out of all 26,555 cases reported during the years 2004 - 2018, the most belonged to the categories: Rescue & EMS (39.0%), Fire (22.1%), and Service Call (12.3%).
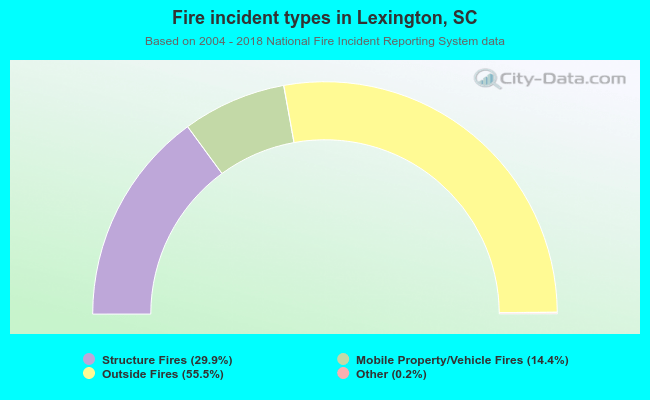 When looking into fire subcategories, the most reports belonged to: Outside Fires (55.5%), and Structure Fires (29.9%).