Charleston: Fire Incidents, Arkansas (AR)
Where are fire incidents reported in Charleston, AR
Something went wrong! Please refresh the page.
|
| |||||||||||||||||||||||||||||||||||||||||||||||||||||||||||||||||||||||||||||||||||||||||||||||||||||||||||||
| Other | 104 | |||||||||||||||||||||||||||||||||||||||||||||||||||||||||||||||||||||||||||||||||||||||||||||||||||||||||||||
2002 - 2018 National Fire Incident Reporting System (NFIRS) incidents
- Incident types reported to NFIRS in Charleston, AR
- 56253.8%Fire
- 34633.1%Rescue & EMS
- 858.1%Good Intent Call
- 292.8%Hazardous Condition
- 151.4%False Alarm
- 20.2%Service Call
- 20.2%Severe Weather
- 20.2%Special Incident
- Fire incident types reported to NFIRS in Charleston, AR
- 36064.1%Outside Fires
- 15527.6%Structure Fires
- 386.8%Mobile Property/Vehicle Fires
- 91.6%Other
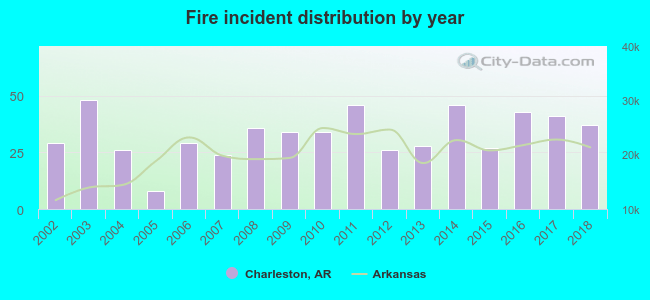 According to the data from the years 2002 - 2018 the average number of fires per year is 33. The highest number of fire incidents - 48 took place in 2003, and the least - 8 in 2005. The data has an increasing trend.
 The median response time based on all reported fire incidents is 8 minutes. This is higher than the Arkansas median value.
The median response time in Charleston, AR compared to nearest cities:
(Note: Based on data for all years, including only cities with at least 500 fire incidents)
| Charleston: | 8 minutes |
| Lavaca: | 6 minutes |
| Booneville: | 12 minutes |
| Greenwood: | 8 minutes |
| Mulberry: | 9 minutes |
| Alma: | 8 minutes |
| Ozark: | 7 minutes |
| Van Buren: | 5 minutes |
| Mansfield: | 9 minutes |
 23.5% incidents where reported in the morning and 76.5% in the evening. The most fires (16.2%) took place on Monday, and the least (11.9%) on Thursday.
 According to the 562 fires from years 2002 - 2018 most fires (16.4%) took place during January, and the least (3.9%) in May.
 Out of all 1,044 cases reported during the years 2002 - 2018, the most belonged to the categories: Fire (53.8%), Rescue & EMS (33.1%), and Good Intent Call (8.1%).
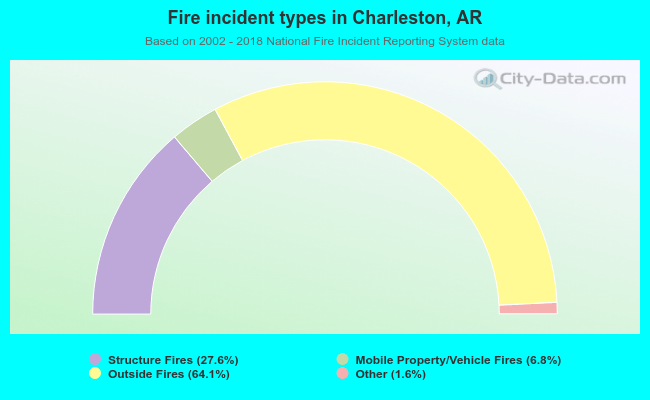 When looking into fire subcategories, the most reports belonged to: Outside Fires (64.1%), and Structure Fires (27.6%).