Van Buren: Fire Incidents, Arkansas (AR)
Where are fire incidents reported in Van Buren, AR
Something went wrong! Please refresh the page.
| Fire incidents reported | |
|---|---|
| Sreet name | Count |
| 28TH ST | 106 |
| FAYETTEVILLE RD | 106 |
| INDUSTRIAL PARK RD | 82 |
| POINTER TRAIL | 76 |
| ALMA HWY | 62 |
| FAYETTEVILLE RD | 62 |
| KIBLER RD | 54 |
| 11TH ST | 50 |
| 13TH ST | 50 |
| 40TH ST | 50 |
| 24TH ST | 46 |
| I-40 | 46 |
| POPLAR | 44 |
| RENA RD | 40 |
| MAIN ST | 38 |
| RUDY RD | 38 |
| 59 HWY | 36 |
| OLD UNIONTOWN RD | 34 |
| 6TH ST | 32 |
| HIGHWAY 282 | 30 |
| I-540 | 30 |
| MAIN | 30 |
| 20TH ST | 28 |
| ALMA HWY | 28 |
| ARKANSAS AVE | 28 |
| CHERRY | 28 |
| ELFEN GLEN DR | 28 |
| 16TH ST | 26 |
| 39TH ST | 26 |
| ALMA HIGHWAY | 26 |
| Other | 1,756 |
2002 - 2018 National Fire Incident Reporting System (NFIRS) incidents
- Incident types reported to NFIRS in Van Buren, AR
- 10,59164.3%Rescue & EMS
- 3,11618.9%Fire
- 8865.4%Good Intent Call
- 8595.2%False Alarm
- 7574.6%Hazardous Condition
- 1881.1%Service Call
- 230.1%Special Incident
- 210.1%Severe Weather
- 180.1%Overpressure Rupture
- Fire incident types reported to NFIRS in Van Buren, AR
- 1,60551.5%Outside Fires
- 89628.8%Structure Fires
- 46314.9%Mobile Property/Vehicle Fires
- 1524.9%Other
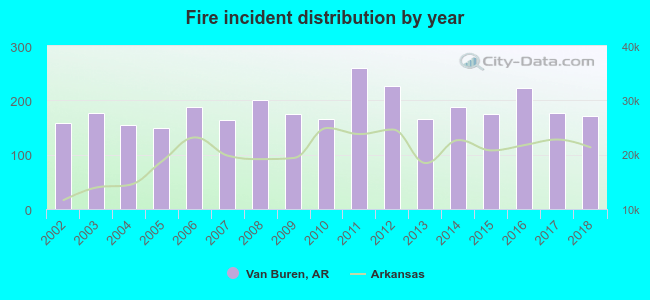 According to the data from the years 2002 - 2018 the average number of fire incidents per year is 183. The highest number of fire incidents - 260 took place in 2011, and the least - 149 in 2005. The data has a growing trend.
The average number of yearly fire incidents per 10k residents in Van Buren, AR compared to nearest cities:
(Note: Based on data for the last 3 years, including only cities with population 5,000 and above)
| Van Buren: | 82.4 |
| Fort Smith: | 46.3 |
| Alma: | 185.9 |
| Greenwood: | 84.2 |
 The median response time based on all reported fire incidents is 5 minutes. This is lower compared to the state median value.
The median response time in Van Buren, AR compared to nearest cities:
(Note: Based on data for all years, including only cities with at least 500 fire incidents)
| Van Buren: | 5 minutes |
| Fort Smith: | 3 minutes |
| Alma: | 8 minutes |
| Lavaca: | 6 minutes |
| Greenwood: | 8 minutes |
| Mountainburg: | 11 minutes |
| Mulberry: | 9 minutes |
| Charleston: | 8 minutes |
| Mansfield: | 9 minutes |
 According to the reports from the years 2002 - 2018 the average number of fire-related yearly casualties is 0. The highest number of reported injuries - 2 took place in 2018, and the lowest - 0 in 2002. The data has a growing trend.
The average number of casualties per 1,000 fire incidents is 2. This indicator was the highest - 12 in 2018, and the lowest 0 in 2002. The trend for casualties per 1,000 fires is growing. Compared to the Arkansas value the number of injuries per 1,000 fire incidents is much lower.
According to the reports from the years 2002 - 2018 the average number of fire-related yearly casualties is 0. The highest number of reported injuries - 2 took place in 2018, and the lowest - 0 in 2002. The data has a growing trend.
The average number of casualties per 1,000 fire incidents is 2. This indicator was the highest - 12 in 2018, and the lowest 0 in 2002. The trend for casualties per 1,000 fires is growing. Compared to the Arkansas value the number of injuries per 1,000 fire incidents is much lower.Casualties per 1,000 incidents in Van Buren, AR compared to nearest cities:
(Note: Based on data for all years, including only cities with at least 500 fire incidents)
| Van Buren: | 1.9 |
| Fort Smith: | 18.2 |
| Alma: | 1.8 |
| Lavaca: | 0.0 |
| Greenwood: | 1.8 |
| Mountainburg: | 3.8 |
| Mulberry: | 5.7 |
| Charleston: | 0.0 |
| Mansfield: | 0.0 |
 26.9% incidents where reported in the morning and 73.1% in the evening. The most fires (16.1%) took place on Saturday, and the least (13.4%) on Monday.
 According to the 3,116 fires from years 2002 - 2018 most fires (11.5%) took place during February, and the least (5.7%) in May.
 Out of all 16,459 cases reported during the years 2002 - 2018, the most belonged to the categories: Rescue & EMS (64.3%), Fire (18.9%), and Good Intent Call (5.4%).
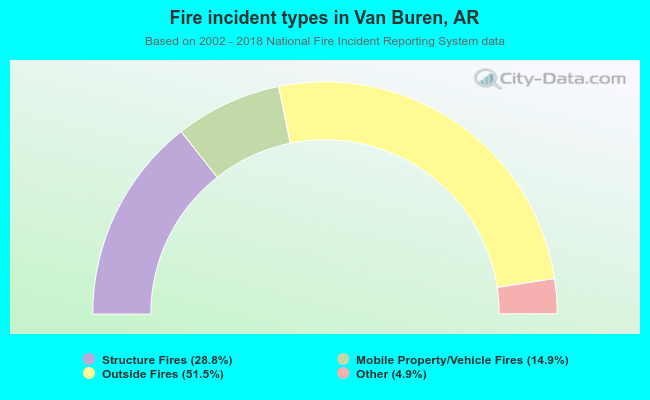 When looking into fire subcategories, the most incidents belonged to: Outside Fires (51.5%), and Structure Fires (28.8%).