Chesterfield: Fire Incidents, Missouri (MO)
Where are fire incidents reported in Chesterfield, MO
Something went wrong! Please refresh the page.
| Fire incidents reported | |
|---|---|
| Sreet name | Count |
| OLIVE BLVD | 106 |
| HIGHWAY 40 EB | 102 |
| CHESTERFIELD AIRPORT RD | 86 |
| HIGHWAY 40 WB | 80 |
| CLARKSON RD | 70 |
| THF BLVD | 48 |
| CLAYTON RD | 44 |
| WILD HORSE CREEK RD | 40 |
| CHESTERFIELD MALL | 38 |
| CLAYTON RD | 36 |
| CLARKSON RD | 30 |
| WOODS MILL RD S | 30 |
| CHESTERFIELD PKWY W | 26 |
| LONG RD | 26 |
| OLIVE BLVD | 26 |
| BAXTER RD | 24 |
| CHESTERFIELD PKWY E | 24 |
| NORTH OUTER FORTY DR | 22 |
| WOODS MILL RD N | 22 |
| CHESTERFIELD AIRPORT RD | 20 |
| CONWAY RD | 20 |
| EATHERTON RD N | 20 |
| ST LUKES HOSPITAL COMPLEX | 20 |
| SWINGLEY RIDGE RD | 20 |
| BANTRY LN | 18 |
| CANTINA DR | 18 |
| GODDARD AV | 18 |
| BROADMOOR DR | 16 |
| CHESTERFIELD MALL | 16 |
| EDISON AVE | 16 |
| Other | 640 |
2002 - 2018 National Fire Incident Reporting System (NFIRS) incidents
- Incident types reported to NFIRS in Chesterfield, MO
- 17,41061.4%Rescue & EMS
- 2,87410.1%False Alarm
- 2,3458.3%Hazardous Condition
- 2,2968.1%Service Call
- 1,7226.1%Fire
- 1,6035.7%Good Intent Call
- 570.2%Overpressure Rupture
- Fire incident types reported to NFIRS in Chesterfield, MO
- 69840.5%Structure Fires
- 61835.9%Outside Fires
- 29817.3%Mobile Property/Vehicle Fires
- 1086.3%Other
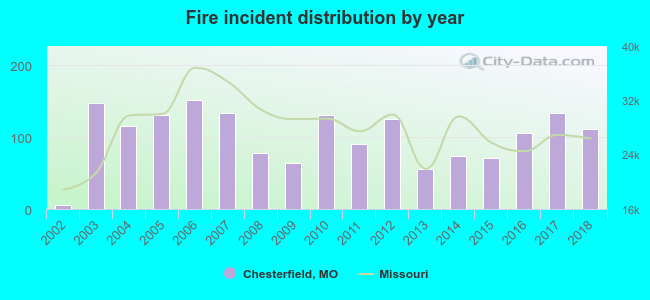 Based on the data from the years 2002 - 2018 the average number of fire incidents per year is 101. The highest number of fires - 151 took place in 2006, and the least - 6 in 2002. The data has an increasing trend.
The average number of yearly fire incidents per 10k residents in Chesterfield, MO compared to nearest cities:
(Note: Based on data for the last 3 years, including only cities with population 5,000 and above)
| Chesterfield: | 24.5 |
| Ballwin: | 19.2 |
| Ellisville: | 55.8 |
| Town and Country: | 26.1 |
| Manchester: | 15.8 |
| Creve Coeur: | 24.3 |
| Weldon Spring: | 1.8 |
| Des Peres: | 19.9 |
| Wildwood: | 16.8 |
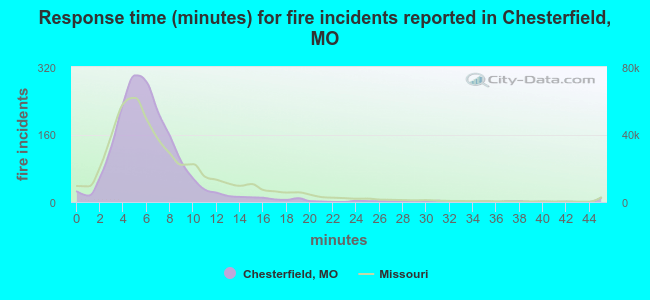 The median response time based on all reported fire incidents is 6 minutes. This is close to the state median value.
The median response time in Chesterfield, MO compared to nearest cities:
(Note: Based on data for all years, including only cities with at least 500 fire incidents)
| Chesterfield: | 6 minutes |
| Ballwin: | 5 minutes |
| Ellisville: | 4 minutes |
| Manchester: | 5 minutes |
| Creve Coeur: | 6 minutes |
| Wildwood: | 6 minutes |
| Maryland Heights: | 5 minutes |
| Valley Park: | 6 minutes |
| St. Peters: | 6 minutes |
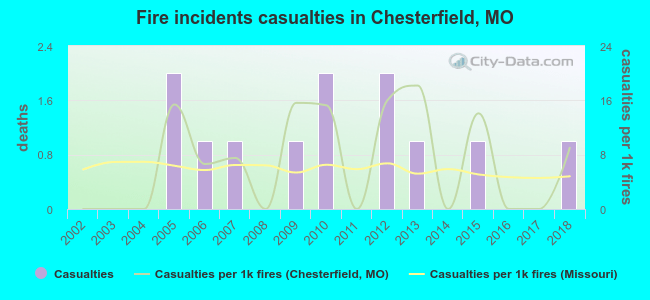 According to the data from the years 2002 - 2018 the average number of fire-related casualties per year is 1. The highest number of casualties - 2 took place in 2005, and the lowest - 0 in 2002. The data has an increasing trend.
The average number of casualties per 1,000 fires is 7. This indicator was the highest - 18 in 2013, and the lowest 0 in 2002. The trend for injuries per 1,000 fires is increasing. Compared to the state value the number of injuries per 1,000 fires is about the same.
According to the data from the years 2002 - 2018 the average number of fire-related casualties per year is 1. The highest number of casualties - 2 took place in 2005, and the lowest - 0 in 2002. The data has an increasing trend.
The average number of casualties per 1,000 fires is 7. This indicator was the highest - 18 in 2013, and the lowest 0 in 2002. The trend for injuries per 1,000 fires is increasing. Compared to the state value the number of injuries per 1,000 fires is about the same.Casualties per 1,000 incidents in Chesterfield, MO compared to nearest cities:
(Note: Based on data for all years, including only cities with at least 500 fire incidents)
| Chesterfield: | 7.0 |
| Ballwin: | 9.9 |
| Ellisville: | 12.1 |
| Manchester: | 10.1 |
| Creve Coeur: | 6.4 |
| Wildwood: | 4.2 |
| Maryland Heights: | 4.0 |
| Valley Park: | 4.4 |
| St. Peters: | 9.4 |
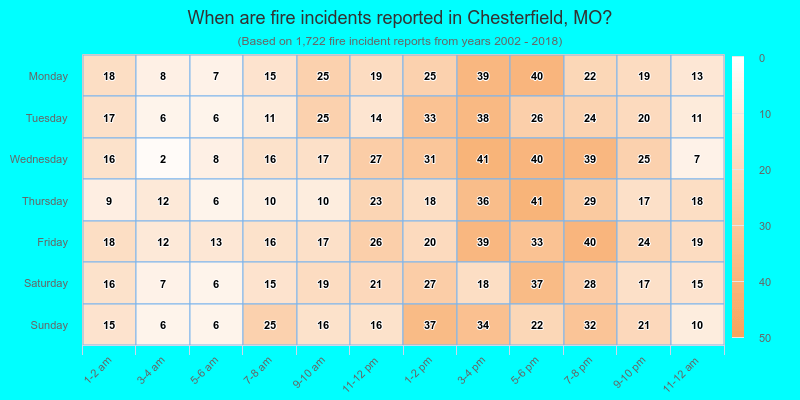
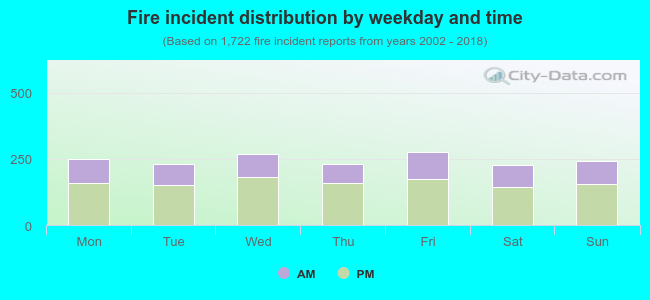 34.7% incidents where reported in the morning and 65.3% in the evening. The most fires (16.1%) took place on Friday, and the least (13.1%) on Saturday.
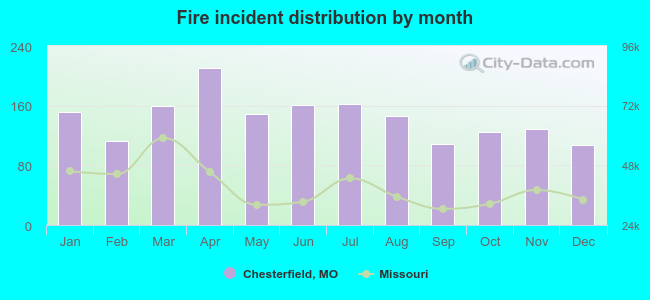 According to the 1,722 fire incident reports from years 2002 - 2018 most fires (12.3%) took place during April, and the least (6.2%) in December.
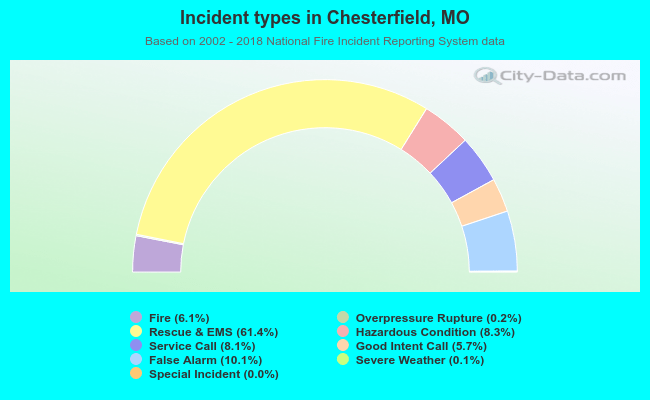 Out of all 28,340 cases reported during the years 2002 - 2018, the most belonged to the categories: Rescue & EMS (61.4%), False Alarm (10.1%), and Hazardous Condition (8.3%).
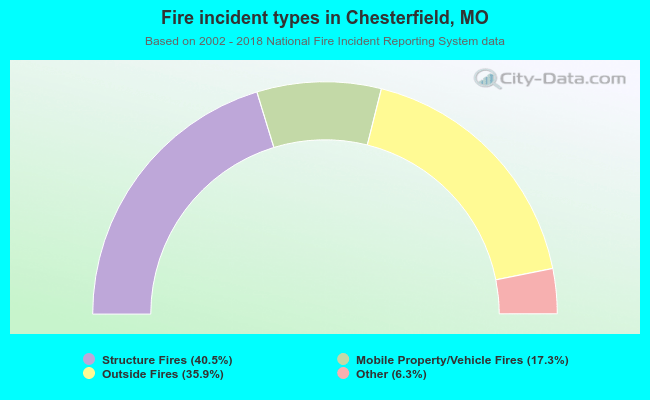 When looking into fire subcategories, the most incidents belonged to: Structure Fires (40.5%), and Outside Fires (35.9%).