Maryland Heights: Fire Incidents, Missouri (MO)
Where are fire incidents reported in Maryland Heights, MO
Something went wrong! Please refresh the page.
| Fire incidents reported | |
|---|---|
| Sreet name | Count |
| DORSETT | 168 |
| I 270 NB | 96 |
| I 270 SB | 84 |
| CREVE COEUR MILL RD | 68 |
| CASINO CENTER DR | 66 |
| MCKELVEY RD | 60 |
| FEE FEE RD | 50 |
| LACKLAND RD | 50 |
| SCHUETZ RD | 44 |
| MCKELVEY RD | 40 |
| RIVERPORT | 40 |
| WESTPORT PLAZA COMPLEX | 40 |
| ADIE | 34 |
| RIVERPORT DR | 34 |
| MCKELVEY HILL DR | 32 |
| WESTLINE INDUSTRIAL | 26 |
| PAGE AVE EB | 24 |
| CRAIG RD | 22 |
| WESTPORT PLAZA DR | 22 |
| DODDRIDGE | 20 |
| DORSETT VILLAGE SHOPPING | 20 |
| BENNINGTON PL | 18 |
| CRAIGSHIRE DR | 18 |
| CREVE COEUR MILL RD | 18 |
| GRISSOM | 18 |
| HIGHWAY 364 WB | 18 |
| INLETRIDGE DR | 18 |
| LAKE POINT DR | 18 |
| PALESTRA DR | 18 |
| HIGHWAY 364 EB | 16 |
| Other | 559 |
2002 - 2018 National Fire Incident Reporting System (NFIRS) incidents
- Incident types reported to NFIRS in Maryland Heights, MO
- 5,59343.9%Rescue & EMS
- 1,91915.1%Hazardous Condition
- 1,75913.8%Fire
- 1,45511.4%False Alarm
- 1,2429.8%Good Intent Call
- 7025.5%Service Call
- 310.2%Overpressure Rupture
- 150.1%Severe Weather
- 140.1%Special Incident
- Fire incident types reported to NFIRS in Maryland Heights, MO
- 60534.4%Structure Fires
- 52329.7%Outside Fires
- 32818.6%Mobile Property/Vehicle Fires
- 30317.2%Other
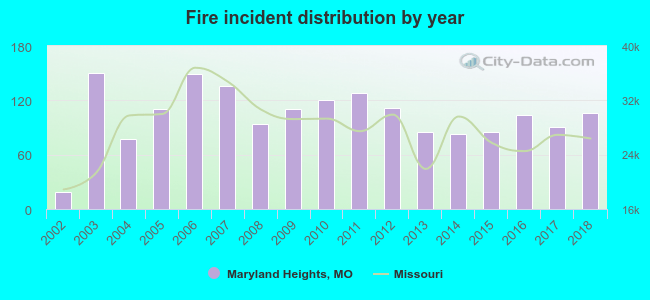 Based on the data from the years 2002 - 2018 the average number of fire incidents per year is 103. The highest number of reported fires - 150 took place in 2003, and the least - 19 in 2002. The data has a rising trend.
The average number of yearly fire incidents per 10k residents in Maryland Heights, MO compared to nearest cities:
(Note: Based on data for the last 3 years, including only cities with population 5,000 and above)
| Maryland Heights: | 36.6 |
| Bridgeton: | 76.7 |
| Creve Coeur: | 24.3 |
| Overland: | 19.6 |
| Olivette: | 45.9 |
| Hazelwood: | 29.2 |
| Town and Country: | 26.1 |
| Berkeley: | 76.3 |
| Ladue: | 48.2 |
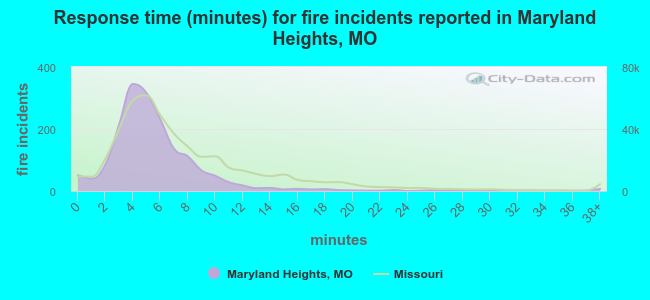 The median response time based on all reported fire incidents is 5 minutes. This is lower than the Missouri median value.
The median response time in Maryland Heights, MO compared to nearest cities:
(Note: Based on data for all years, including only cities with at least 500 fire incidents)
| Maryland Heights: | 5 minutes |
| Bridgeton: | 5 minutes |
| Creve Coeur: | 6 minutes |
| Overland: | 5 minutes |
| Olivette: | 5 minutes |
| St. Charles: | 6 minutes |
| Hazelwood: | 6 minutes |
| Berkeley: | 4 minutes |
| Ladue: | 6 minutes |
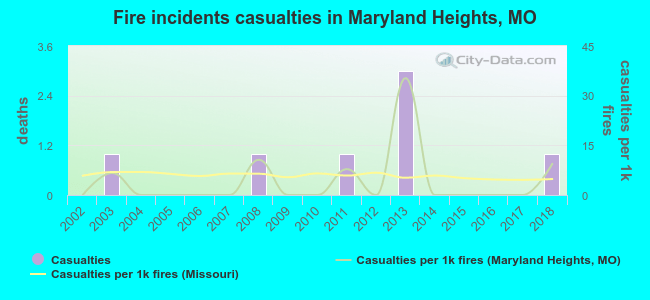 According to the reports from the years 2002 - 2018 the average number of fire-related yearly casualties is 0. The highest number of reported casualties - 3 took place in 2013, and the lowest - 0 in 2002. The data has a growing trend.
The average number of casualties per 1,000 fire incidents is 4. This indicator was the highest - 35 in 2013, and the lowest 0 in 2002. The trend for injuries per 1,000 fire incidents is growing. Compared to the Missouri value the number of injuries per 1,000 fires is lower.
According to the reports from the years 2002 - 2018 the average number of fire-related yearly casualties is 0. The highest number of reported casualties - 3 took place in 2013, and the lowest - 0 in 2002. The data has a growing trend.
The average number of casualties per 1,000 fire incidents is 4. This indicator was the highest - 35 in 2013, and the lowest 0 in 2002. The trend for injuries per 1,000 fire incidents is growing. Compared to the Missouri value the number of injuries per 1,000 fires is lower.Casualties per 1,000 incidents in Maryland Heights, MO compared to nearest cities:
(Note: Based on data for all years, including only cities with at least 500 fire incidents)
| Maryland Heights: | 4.0 |
| Bridgeton: | 3.0 |
| Creve Coeur: | 6.4 |
| Overland: | 3.6 |
| Olivette: | 5.4 |
| St. Charles: | 8.3 |
| Hazelwood: | 0.0 |
| Berkeley: | 12.4 |
| Ladue: | 1.7 |
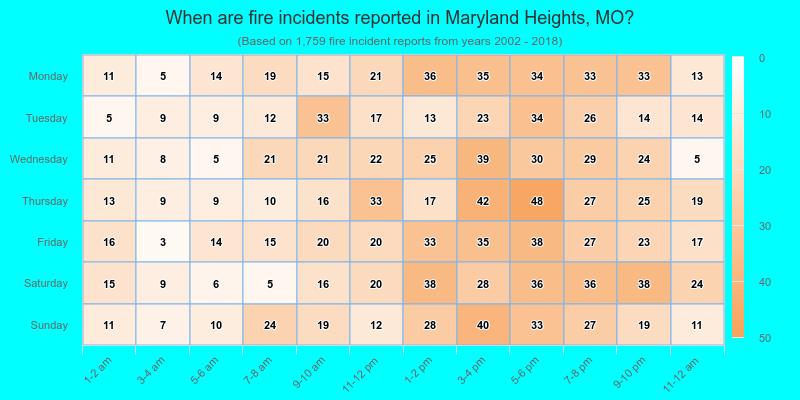
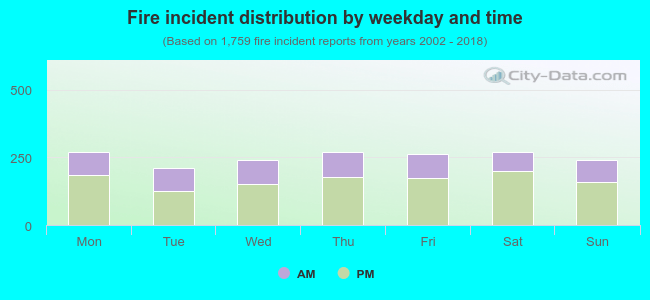 33.5% incidents where reported in the morning and 66.5% in the evening. The most fires (15.4%) took place on Saturday, and the least (11.9%) on Tuesday.
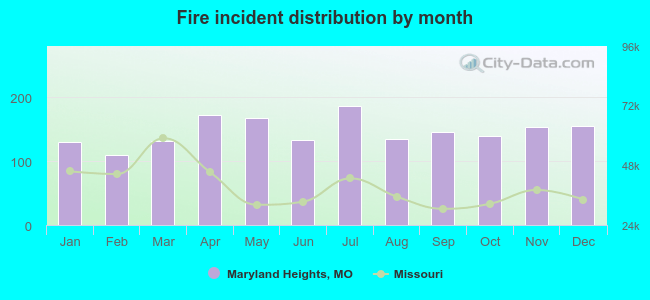 According to the 1,759 fire incident reports from years 2002 - 2018 most fires (10.6%) took place during July, and the least (6.3%) in February.
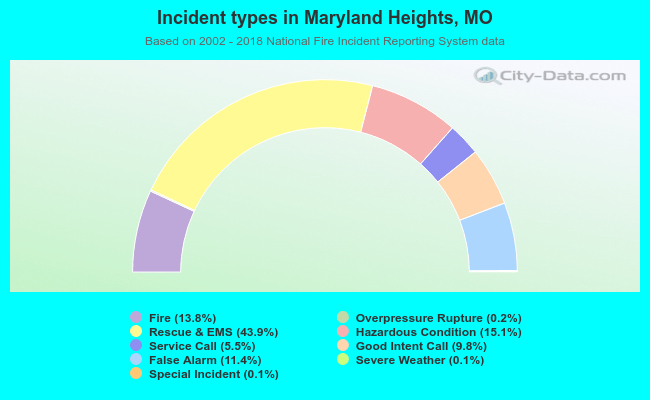 Out of all 12,730 cases reported during the years 2002 - 2018, the most belonged to the categories: Rescue & EMS (43.9%), Hazardous Condition (15.1%), and Fire (13.8%).
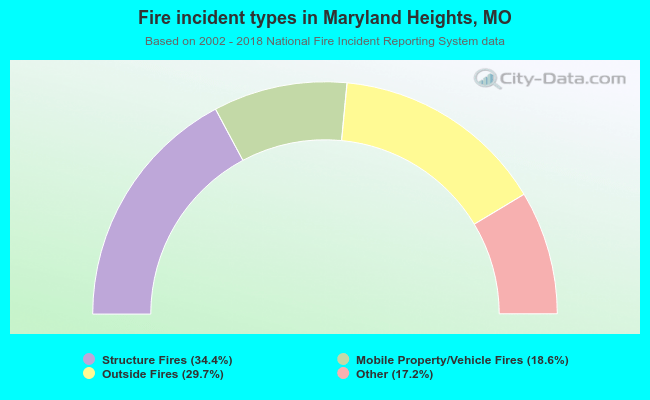 When looking into fire subcategories, the most reports belonged to: Structure Fires (34.4%), and Outside Fires (29.7%).