Chillicothe: Fire Incidents, Illinois (IL)
Where are fire incidents reported in Chillicothe, IL
Something went wrong! Please refresh the page.
|
| |||||||||||||||||||||||||||||||||||||||||||||||||||||||||||||||||||||||||||||||||||||||||||||||||||||||||||||
2007 - 2018 National Fire Incident Reporting System (NFIRS) incidents
- Incident types reported to NFIRS in Chillicothe, IL
- 3,13667.7%Rescue & EMS
- 55011.9%Fire
- 3958.5%Good Intent Call
- 2485.4%Hazardous Condition
- 2034.4%False Alarm
- 691.5%Service Call
- 150.3%Special Incident
- 130.3%Severe Weather
- Fire incident types reported to NFIRS in Chillicothe, IL
- 24043.6%Outside Fires
- 18734.0%Structure Fires
- 7714.0%Mobile Property/Vehicle Fires
- 468.4%Other
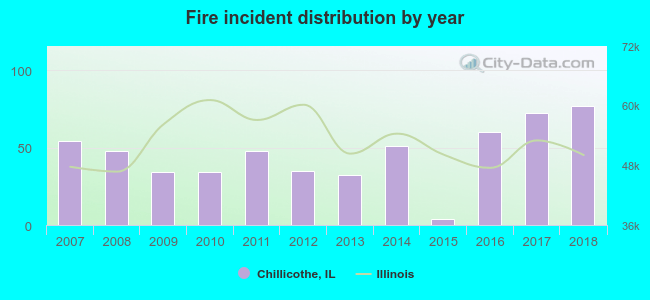 According to the data from the years 2007 - 2018 the average number of fire incidents per year is 46. The highest number of reported fires - 77 took place in 2018, and the least - 4 in 2015. The data has a growing trend.
The average number of yearly fire incidents per 10k residents in Chillicothe, IL compared to nearest cities:
(Note: Based on data for the last 3 years, including only cities with population 5,000 and above)
| Chillicothe: | 113.6 |
| Peoria Heights: | 38.8 |
| Peoria: | 55.5 |
| Washington: | 44.0 |
| East Peoria: | 31.7 |
| Eureka: | 23.6 |
| Creve Coeur: | 26.7 |
| Bartonville: | 21.8 |
| Morton: | 18.6 |
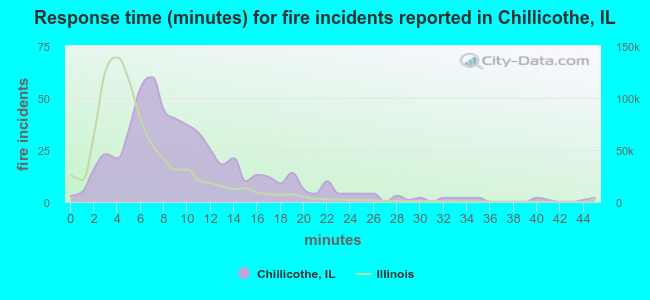 The median response time based on all reported fire incidents is 9 minutes. This is higher compared to the state median value.
The median response time in Chillicothe, IL compared to nearest cities:
(Note: Based on data for all years, including only cities with at least 500 fire incidents)
| Chillicothe: | 9 minutes |
| Metamora: | 8 minutes |
| Peoria: | 4 minutes |
| Washington: | 7 minutes |
| East Peoria: | 5 minutes |
| Morton: | 8 minutes |
| Pekin: | 4 minutes |
| Kewanee: | 3 minutes |
| Princeton: | 8 minutes |
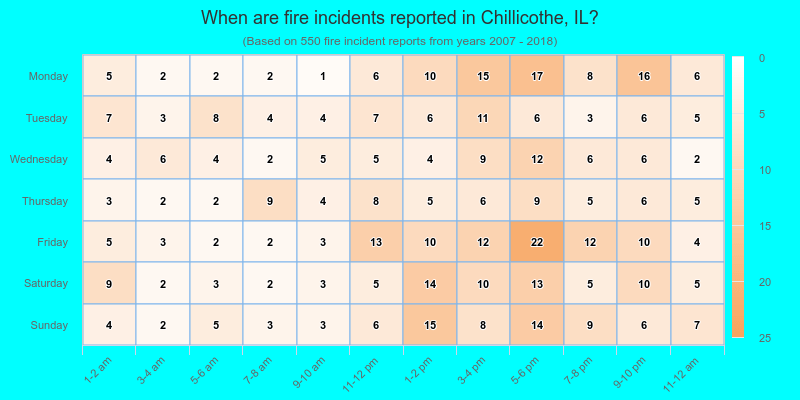
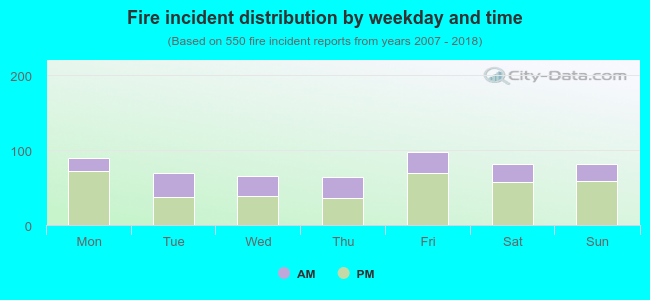 32.7% incidents where reported in the morning and 67.3% in the evening. The most fires (17.8%) took place on Friday, and the least (11.6%) on Thursday.
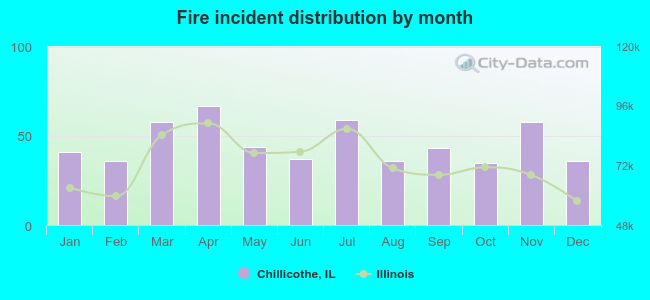 Based on the 550 incident reports from years 2007 - 2018 most fires (12.2%) took place during April, and the least (6.4%) in October.
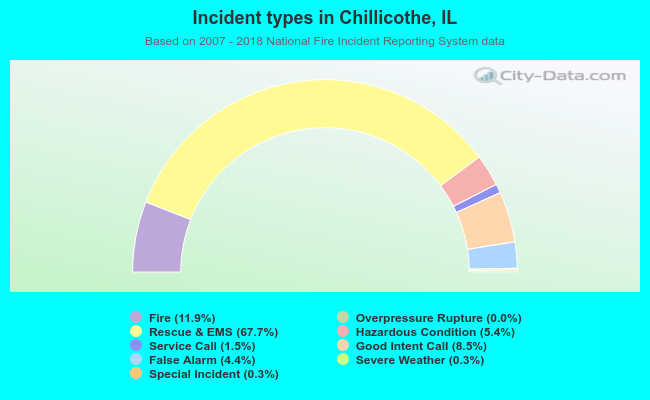 Out of all 4,630 cases reported during the years 2007 - 2018, the most belonged to the categories: Rescue & EMS (67.7%), Fire (11.9%), and Good Intent Call (8.5%).
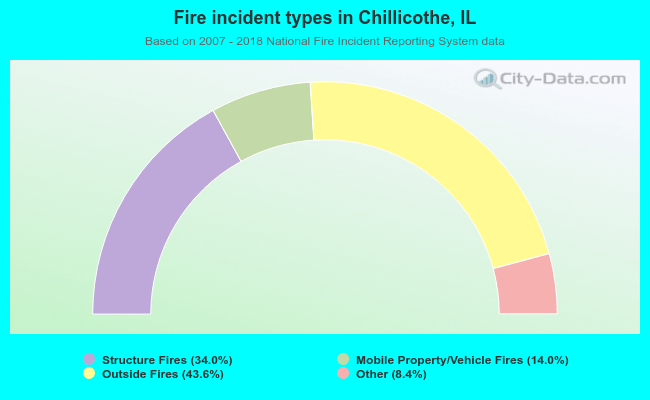 When looking into fire subcategories, the most reports belonged to: Outside Fires (43.6%), and Structure Fires (34.0%).