Washington: Fire Incidents, Illinois (IL)
Where are fire incidents reported in Washington, IL
Something went wrong! Please refresh the page.
| Fire incidents reported | |
|---|---|
| Sreet name | Count |
| WASHINGTON RD | 114 |
| PEORIA ST | 42 |
| GEORGETOWN RD | 38 |
| CRUGER RD | 34 |
| CUMMINGS LN | 34 |
| JEFFERSON ST | 32 |
| ADAMS ST | 24 |
| MAIN ST | 24 |
| SPRING CREEK RD | 24 |
| BESS ST | 22 |
| BOYD PKY | 22 |
| CHERRY TREE | 20 |
| LEGION RD | 20 |
| MULLER RD | 20 |
| WASHINGTON RD | 18 |
| COOPER RD | 16 |
| COURT DR | 16 |
| DEVONSHIRE RD | 16 |
| HIGH ST | 16 |
| HILLDALE AVE | 16 |
| IRISH LN | 16 |
| NEWCASTLE RD | 16 |
| SCHOOL ST | 16 |
| AUTUMN RIDGE | 14 |
| BONDURANT ST | 14 |
| CARLSON AVE | 14 |
| GUTH RD | 14 |
| TAZEWOOD RD | 14 |
| WILMOR RD | 14 |
| BITTERSWEET RD | 12 |
| Other | 322 |
2002 - 2018 National Fire Incident Reporting System (NFIRS) incidents
- Incident types reported to NFIRS in Washington, IL
- 6,41971.9%Rescue & EMS
- 1,03411.6%Fire
- 5646.3%False Alarm
- 5305.9%Hazardous Condition
- 2032.3%Good Intent Call
- 1621.8%Service Call
- 100.1%Severe Weather
- Fire incident types reported to NFIRS in Washington, IL
- 42741.3%Structure Fires
- 36435.2%Outside Fires
- 14413.9%Other
- 999.6%Mobile Property/Vehicle Fires
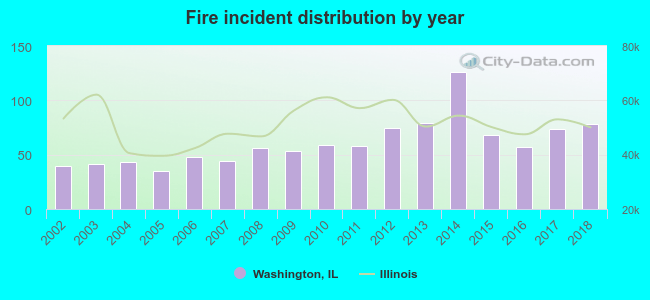 Based on the data from the years 2002 - 2018 the average number of fire incidents per year is 61. The highest number of fires - 126 took place in 2014, and the least - 35 in 2005. The data has an increasing trend.
The average number of yearly fire incidents per 10k residents in Washington, IL compared to nearest cities:
(Note: Based on data for the last 3 years, including only cities with population 5,000 and above)
| Washington: | 44.0 |
| Morton: | 18.6 |
| East Peoria: | 31.7 |
| Eureka: | 23.6 |
| Peoria Heights: | 38.8 |
| Peoria: | 55.5 |
| Creve Coeur: | 26.7 |
| Bartonville: | 21.8 |
| Pekin: | 53.8 |
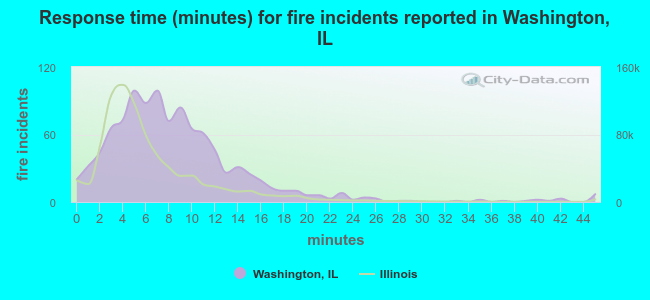 The median response time based on all reported fire incidents is 7 minutes. This is higher than the state median value.
The median response time in Washington, IL compared to nearest cities:
(Note: Based on data for all years, including only cities with at least 500 fire incidents)
| Washington: | 7 minutes |
| Metamora: | 8 minutes |
| Morton: | 8 minutes |
| East Peoria: | 5 minutes |
| Peoria: | 4 minutes |
| Pekin: | 4 minutes |
| Chillicothe: | 9 minutes |
| Normal: | 5 minutes |
| Bloomington: | 5 minutes |
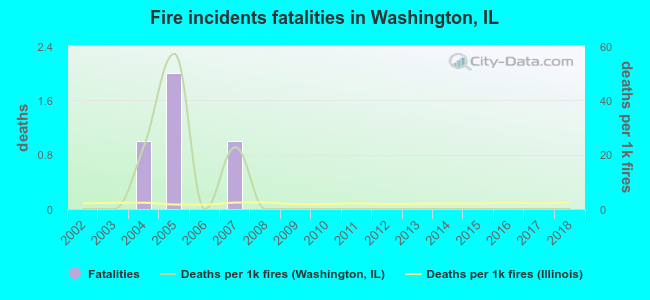 According to the reports from the years 2002 - 2018 the average number of fire-related fatalities per year is 0. The highest number of reported deaths - 2 took place in 2005, and the lowest - 0 in 2002. The data has a constant trend.
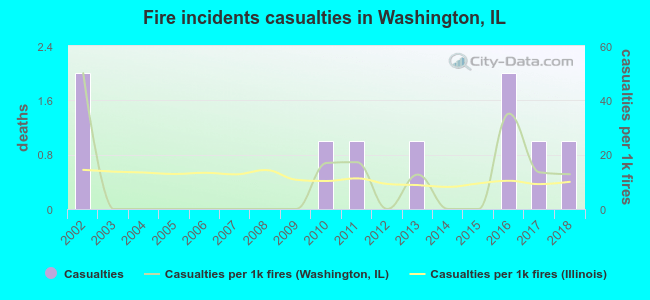 According to the data from the years 2002 - 2018 the average number of fire-related casualties per year is 1. The highest number of reported casualties - 2 took place in 2002, and the lowest - 0 in 2003. The data has a declining trend.
The average number of injuries per 1,000 fire incidents is 9. This indicator was the highest - 50 in 2002, and the lowest 0 in 2003. The trend for injuries per 1,000 fires is dropping. Compared to the Illinois value the number of casualties per 1,000 fire incidents is lower.
According to the data from the years 2002 - 2018 the average number of fire-related casualties per year is 1. The highest number of reported casualties - 2 took place in 2002, and the lowest - 0 in 2003. The data has a declining trend.
The average number of injuries per 1,000 fire incidents is 9. This indicator was the highest - 50 in 2002, and the lowest 0 in 2003. The trend for injuries per 1,000 fires is dropping. Compared to the Illinois value the number of casualties per 1,000 fire incidents is lower.Casualties per 1,000 incidents in Washington, IL compared to nearest cities:
(Note: Based on data for all years, including only cities with at least 500 fire incidents)
| Washington: | 8.7 |
| Metamora: | 1.9 |
| Morton: | 29.1 |
| East Peoria: | 12.3 |
| Peoria: | 17.2 |
| Pekin: | 21.5 |
| Chillicothe: | 0.0 |
| Normal: | 10.7 |
| Bloomington: | 20.8 |
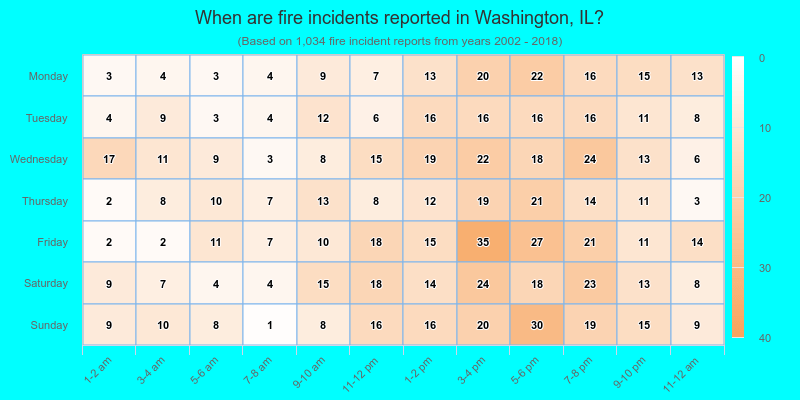
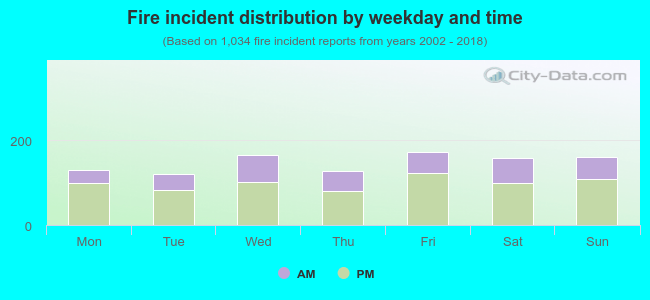 32.7% incidents where reported in the morning and 67.3% in the evening. The most fires (16.7%) took place on Friday, and the least (11.7%) on Tuesday.
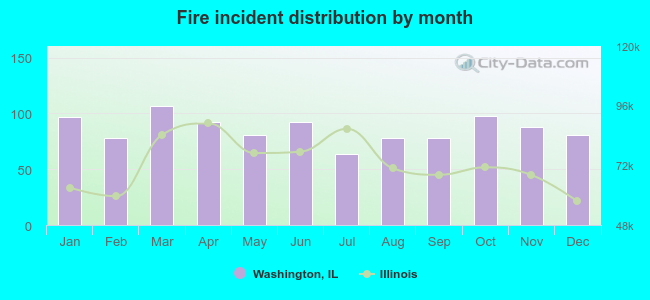 According to the 1,034 fire incidents from years 2002 - 2018 most fires (10.3%) took place during March, and the least (6.2%) in July.
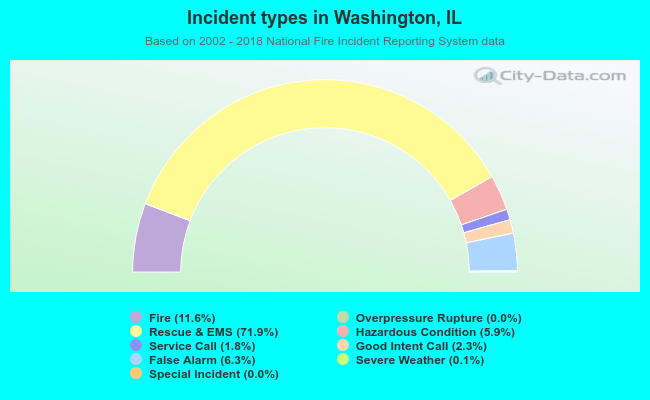 Out of all 8,928 cases reported during the years 2002 - 2018, the most belonged to the categories: Rescue & EMS (71.9%), Fire (11.6%), and False Alarm (6.3%).
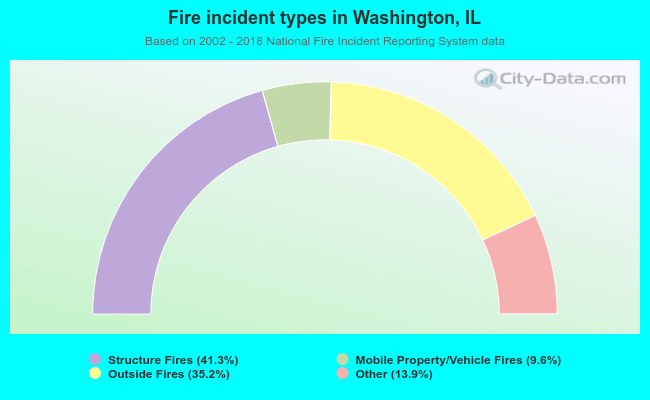 When looking into fire subcategories, the most reports belonged to: Structure Fires (41.3%), and Outside Fires (35.2%).