Cincinnati: Fire Incidents, Ohio (OH)
Where are fire incidents reported in Cincinnati, OH
Something went wrong! Please refresh the page.
| Fire incidents reported | |
|---|---|
| Sreet name | Count |
| HARRISON AVE | 382 |
| HAMILTON AVE | 372 |
| DELHI RD | 322 |
| BEECHMONT AVE | 310 |
| WINTON RD | 306 |
| NORTH BEND RD | 296 |
| MONTGOMERY RD | 282 |
| GALBRAITH RD | 230 |
| BRIDGETOWN RD | 222 |
| WALDEN GLEN CIR | 214 |
| COLERAIN AVE | 206 |
| COLERAIN (7000-8199) AVE | 192 |
| MEREDITH DR | 168 |
| GLENWAY AVE | 166 |
| DALY RD | 154 |
| CHEVIOT RD | 150 |
| COLERAIN (8200-9100) AVE | 146 |
| COMPTON RD | 146 |
| COLERAIN (9101-9750) AVE | 144 |
| READING RD | 134 |
| VINE ST | 132 |
| INTERSTATE 74 | 126 |
| EBENEZER RD | 122 |
| HARRISON AV | 122 |
| COLERAIN (9750-10330) AVE | 116 |
| INTERSTATE 275 HWY | 116 |
| FIVE MILE RD | 110 |
| READING RD | 108 |
| LOSANTIVILLE AVE | 106 |
| RIDGE RD | 106 |
| Other | 15,784 |
2002 - 2018 National Fire Incident Reporting System (NFIRS) incidents
- Incident types reported to NFIRS in Cincinnati, OH
- 103,10051.7%Rescue & EMS
- 25,42212.8%Hazardous Condition
- 22,21911.2%False Alarm
- 21,49010.8%Fire
- 15,3347.7%Good Intent Call
- 10,1075.1%Service Call
- 6480.3%Severe Weather
- 4940.2%Special Incident
- 4350.2%Overpressure Rupture
- Fire incident types reported to NFIRS in Cincinnati, OH
- 11,33652.8%Structure Fires
- 6,77231.5%Outside Fires
- 3,19114.8%Mobile Property/Vehicle Fires
- 1910.9%Other
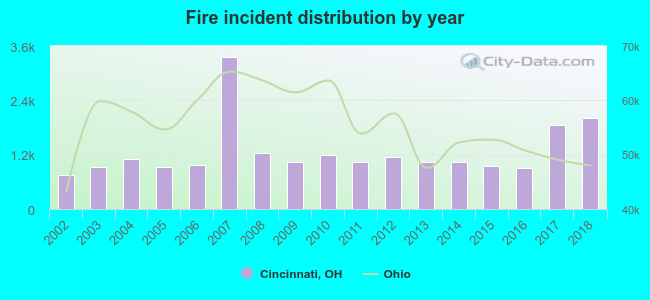 Based on the data from the years 2002 - 2018 the average number of fires per year is 1,264. The highest number of fire incidents - 3,361 took place in 2007, and the least - 741 in 2002. The data has a rising trend.
The average number of yearly fire incidents per 10k residents in Cincinnati, OH compared to nearest cities:
(Note: Based on data for the last 3 years, including only cities with population 5,000 and above)
| Cincinnati: | 53.3 |
| Norwood: | 47.8 |
| Cheviot: | 41.6 |
| North College Hill: | 23.5 |
| Wyoming: | 21.0 |
| Reading: | 56.7 |
| Mount Healthy: | 2.7 |
| Bridgetown: | 1.7 |
| Deer Park: | 26.9 |
 The median response time based on all reported fire incidents is 5 minutes. This is lower compared to the state median value.
The median response time in Cincinnati, OH compared to nearest cities:
(Note: Based on data for all years, including only cities with at least 500 fire incidents)
| Cincinnati: | 5 minutes |
| Norwood: | 3 minutes |
| Newport: | 4 minutes |
| Covington: | 4 minutes |
| Cheviot: | 4 minutes |
| Fort Wright: | 6 minutes |
| Wyoming: | 5 minutes |
| Lockland: | 6 minutes |
| Reading: | 5 minutes |
 Based on the reports from the years 2002 - 2018 the average number of fire-related fatalities per year is 2. The highest number of reported deaths - 6 took place in 2017, and the lowest - 0 in 2005. The data has an increasing trend.
The average number of fatalities per 1,000 fires is 1. This indicator was the highest - 4 in 2016, and the lowest 0 in 2005. The trend for fatalities per 1,000 incidents is increasing. Compared to the state value the number of deaths per 1,000 incidents is lower.
Based on the reports from the years 2002 - 2018 the average number of fire-related fatalities per year is 2. The highest number of reported deaths - 6 took place in 2017, and the lowest - 0 in 2005. The data has an increasing trend.
The average number of fatalities per 1,000 fires is 1. This indicator was the highest - 4 in 2016, and the lowest 0 in 2005. The trend for fatalities per 1,000 incidents is increasing. Compared to the state value the number of deaths per 1,000 incidents is lower.Deaths per 1,000 incidents in Cincinnati, OH compared to nearest cities:
(Note: Based on data for all years, including only cities with at least 2,500 fire incidents)
| Cincinnati: | 1.4 |
 Based on the reports from the years 2002 - 2018 the average number of fire-related casualties per year is 20. The highest number of reported casualties - 32 took place in 2007, and the lowest - 8 in 2013. The data has a growing trend.
The average number of casualties per 1,000 fire incidents is 17. This indicator was the highest - 28 in 2006, and the lowest 8 in 2013. The trend for injuries per 1,000 fire incidents is decreasing. Compared to the Ohio value the number of casualties per 1,000 fire incidents is similar.
Based on the reports from the years 2002 - 2018 the average number of fire-related casualties per year is 20. The highest number of reported casualties - 32 took place in 2007, and the lowest - 8 in 2013. The data has a growing trend.
The average number of casualties per 1,000 fire incidents is 17. This indicator was the highest - 28 in 2006, and the lowest 8 in 2013. The trend for injuries per 1,000 fire incidents is decreasing. Compared to the Ohio value the number of casualties per 1,000 fire incidents is similar.
 29.5% incidents where reported in the morning and 70.5% in the evening. The most fires (15.8%) took place on Sunday, and the least (13.1%) on Thursday.
 According to the 21,490 fire incident reports from years 2002 - 2018 most fires (9.5%) took place during April, and the least (7.0%) in February.
 Out of all 199,249 cases reported during the years 2002 - 2018, the most belonged to the categories: Rescue & EMS (51.7%), Hazardous Condition (12.8%), and False Alarm (11.2%).
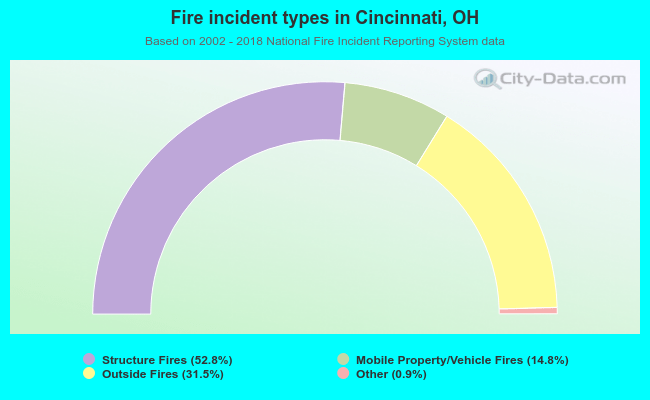 When looking into fire subcategories, the most reports belonged to: Structure Fires (52.8%), and Outside Fires (31.5%).