Fort Wright: Fire Incidents, Kentucky (KY)
Where are fire incidents reported in Fort Wright, KY
Something went wrong! Please refresh the page.
|
| |||||||||||||||||||||||||||||||||||||||||||||||||||||||||||||||||||||||||||||||||||||||||||||||||||||||||||||
2002 - 2018 National Fire Incident Reporting System (NFIRS) incidents
- Incident types reported to NFIRS in Fort Wright, KY
- 63932.3%Hazardous Condition
- 50925.7%Fire
- 30315.3%Good Intent Call
- 1879.4%False Alarm
- 1819.1%Rescue & EMS
- 1286.5%Service Call
- 261.3%Severe Weather
- 60.3%Overpressure Rupture
- 20.1%Special Incident
- Fire incident types reported to NFIRS in Fort Wright, KY
- 22444.0%Mobile Property/Vehicle Fires
- 17835.0%Outside Fires
- 10119.8%Structure Fires
- 61.2%Other
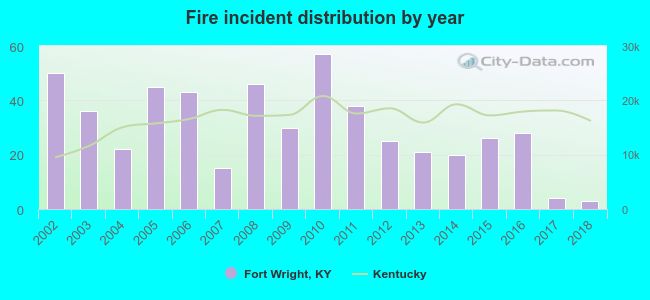 Based on the data from the years 2002 - 2018 the average number of fire incidents per year is 30. The highest number of fires - 57 took place in 2010, and the least - 3 in 2018. The data has a declining trend.
The average number of yearly fire incidents per 10k residents in Fort Wright, KY compared to nearest cities:
(Note: Based on data for the last 3 years, including only cities with population 5,000 and above)
| Fort Wright: | 20.3 |
| Fort Mitchell: | 26.6 |
| Covington: | 49.4 |
| Villa Hills: | 16.2 |
| Taylor Mill: | 24.8 |
| Newport: | 44.7 |
| Edgewood: | 17.9 |
| Erlanger: | 44.2 |
| Highland Heights: | 13.4 |
 The median response time based on all reported fire incidents is 6 minutes. This is similar to the state median value.
The median response time in Fort Wright, KY compared to nearest cities:
(Note: Based on data for all years, including only cities with at least 500 fire incidents)
| Fort Wright: | 6 minutes |
| Covington: | 4 minutes |
| Newport: | 4 minutes |
| Erlanger: | 5 minutes |
| Independence: | 5 minutes |
| Florence: | 6 minutes |
| Burlington: | 7 minutes |
| Alexandria: | 7 minutes |
| Hebron: | 6 minutes |
 30.3% incidents where reported in the morning and 69.7% in the evening. The most fires (17.5%) took place on Monday, and the least (11.0%) on Sunday.
 According to the 509 incident reports from years 2002 - 2018 most fires (12.0%) took place during August, and the least (4.9%) in February.
 Out of all 1,981 cases reported during the years 2002 - 2018, the most belonged to the categories: Hazardous Condition (32.3%), Fire (25.7%), and Good Intent Call (15.3%).
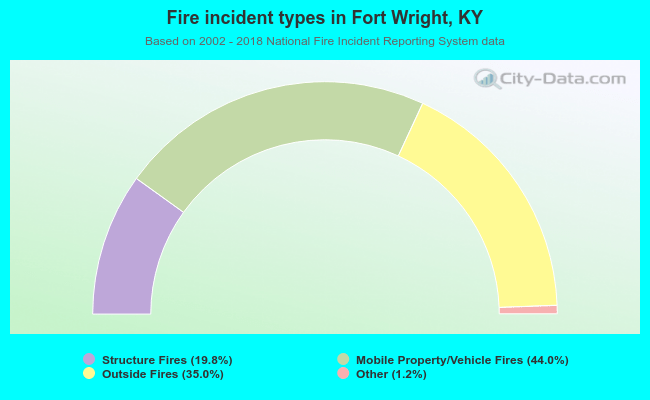 When looking into fire subcategories, the most incidents belonged to: Mobile Property/Vehicle Fires (44.0%), and Outside Fires (35.0%).