Clarendon Hills: Fire Incidents, Illinois (IL)
Where are fire incidents reported in Clarendon Hills, IL
Something went wrong! Please refresh the page.
|
| |||||||||||||||||||||||||||||||||||||||||||||||||||||||||||||||||||||||||||||||||||||||||||||||||||||||||||||
2002 - 2018 National Fire Incident Reporting System (NFIRS) incidents
- Incident types reported to NFIRS in Clarendon Hills, IL
- 2,54238.7%Rescue & EMS
- 1,41321.5%False Alarm
- 1,08516.5%Hazardous Condition
- 88313.5%Service Call
- 3124.8%Fire
- 3114.7%Good Intent Call
- 150.2%Severe Weather
- Fire incident types reported to NFIRS in Clarendon Hills, IL
- 15148.4%Structure Fires
- 12540.1%Outside Fires
- 247.7%Mobile Property/Vehicle Fires
- 123.8%Other
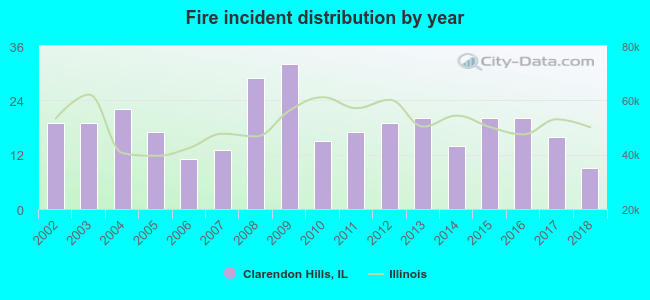 According to the data from the years 2002 - 2018 the average number of fire incidents per year is 18. The highest number of reported fires - 32 took place in 2009, and the least - 9 in 2018. The data has a dropping trend.
The average number of yearly fire incidents per 10k residents in Clarendon Hills, IL compared to nearest cities:
(Note: Based on data for the last 3 years, including only cities with population 5,000 and above)
| Clarendon Hills: | 17.3 |
| Westmont: | 22.6 |
| Hinsdale: | 25.2 |
| Willowbrook: | 46.0 |
| Western Springs: | 18.3 |
| Oak Brook: | 71.9 |
| Downers Grove: | 20.0 |
| Burr Ridge: | 28.8 |
| Darien: | 21.1 |

 Based on the data from the years 2002 - 2018 the average number of fire-related casualties per year is 0. The highest number of casualties - 4 took place in 2005, and the lowest - 0 in 2002. The data has a constant trend.
 32.1% incidents where reported in the morning and 67.9% in the evening. The most fires (17.3%) took place on Friday, and the least (10.3%) on Wednesday.
 According to the 312 fires from years 2002 - 2018 most fires (14.4%) took place during June, and the least (3.5%) in February.
 Out of all 6,563 cases reported during the years 2002 - 2018, the most belonged to the categories: Rescue & EMS (38.7%), False Alarm (21.5%), and Hazardous Condition (16.5%).
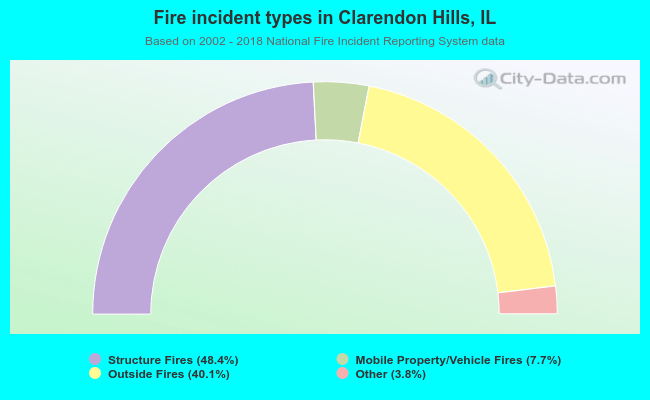 When looking into fire subcategories, the most incidents belonged to: Structure Fires (48.4%), and Outside Fires (40.1%).