Darien: Fire Incidents, Illinois (IL)
Where are fire incidents reported in Darien, IL
Something went wrong! Please refresh the page.
| Fire incidents reported | |
|---|---|
| Sreet name | Count |
| 75TH ST | 118 |
| CASS AVE | 102 |
| PLAINFIELD RD | 86 |
| LEMONT RD | 80 |
| CLARENDON HILLS RD | 68 |
| FARMINGDALE DR | 68 |
| FRONTAGE RD | 40 |
| I-55 | 40 |
| LAKEVIEW DR | 34 |
| 71ST ST | 30 |
| CAPTONS LN | 24 |
| 69TH ST | 22 |
| CASS | 22 |
| ROBERT KINGERY HWY | 20 |
| ANDERMANN LN | 18 |
| CHALET DR | 18 |
| IRIS RD | 16 |
| IRONWOOD | 16 |
| KINGERY HWY | 16 |
| KNOTTINGHAM CIR | 16 |
| WOODLAND DR | 16 |
| 79TH ST | 14 |
| 83RD ST | 14 |
| 91ST ST | 14 |
| BROOKBANK RD | 14 |
| CARLISLE CT | 14 |
| NANTUCKET DR | 14 |
| BROOKDALE DR | 12 |
| CONCORD PL | 12 |
| COUNTRY LN | 12 |
| Other | 98 |
2003 - 2018 National Fire Incident Reporting System (NFIRS) incidents
- Incident types reported to NFIRS in Darien, IL
- 6,73651.8%Rescue & EMS
- 1,80013.8%False Alarm
- 1,2839.9%Hazardous Condition
- 1,2409.5%Service Call
- 1,0888.4%Fire
- 8326.4%Good Intent Call
- 160.1%Overpressure Rupture
- Fire incident types reported to NFIRS in Darien, IL
- 54249.8%Structure Fires
- 33530.8%Outside Fires
- 18316.8%Mobile Property/Vehicle Fires
- 282.6%Other
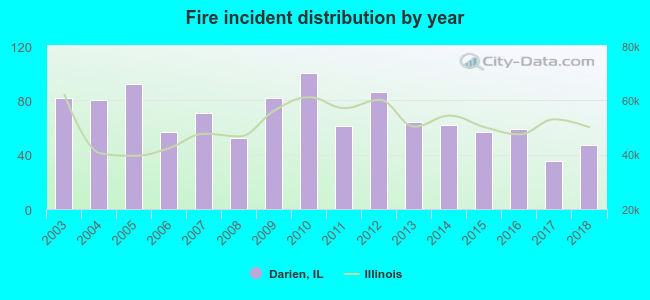 According to the data from the years 2003 - 2018 the average number of fire incidents per year is 68. The highest number of fires - 100 took place in 2010, and the least - 35 in 2017. The data has a dropping trend.
The average number of yearly fire incidents per 10k residents in Darien, IL compared to nearest cities:
(Note: Based on data for the last 3 years, including only cities with population 5,000 and above)
| Darien: | 21.1 |
| Willowbrook: | 46.0 |
| Burr Ridge: | 28.8 |
| Woodridge: | 20.6 |
| Westmont: | 22.6 |
| Downers Grove: | 20.0 |
| Clarendon Hills: | 17.3 |
| Hinsdale: | 25.2 |
| Lemont: | 40.6 |
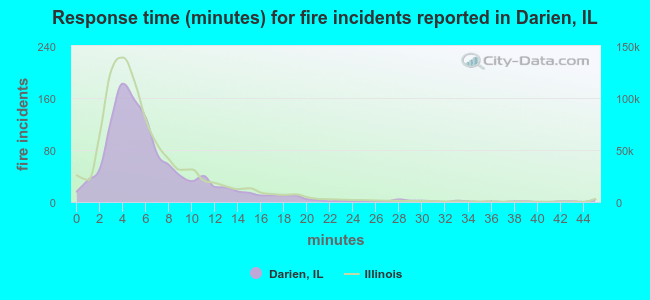 The median response time based on all reported fire incidents is 5 minutes. This is about the same as the state median value.
The median response time in Darien, IL compared to nearest cities:
(Note: Based on data for all years, including only cities with at least 500 fire incidents)
| Darien: | 5 minutes |
| Willowbrook: | 5 minutes |
| Burr Ridge: | 7 minutes |
| Woodridge: | 5 minutes |
| Westmont: | 5 minutes |
| Downers Grove: | 5 minutes |
| Hinsdale: | 5 minutes |
| Lemont: | 7 minutes |
| Lisle: | 5 minutes |
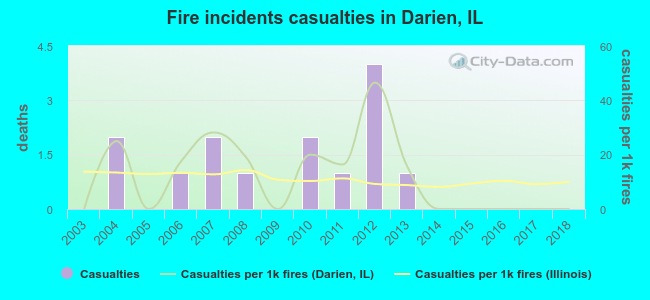 Based on the data from the years 2003 - 2018 the average number of fire-related casualties per year is 1. The highest number of casualties - 4 took place in 2012, and the lowest - 0 in 2003. The data has a constant trend.
The average number of injuries per 1,000 fires is 12. This indicator was the highest - 47 in 2012, and the lowest 0 in 2003. The trend for injuries per 1,000 fire incidents is constant. Compared to the Illinois value the number of casualties per 1,000 fire incidents is about the same.
Based on the data from the years 2003 - 2018 the average number of fire-related casualties per year is 1. The highest number of casualties - 4 took place in 2012, and the lowest - 0 in 2003. The data has a constant trend.
The average number of injuries per 1,000 fires is 12. This indicator was the highest - 47 in 2012, and the lowest 0 in 2003. The trend for injuries per 1,000 fire incidents is constant. Compared to the Illinois value the number of casualties per 1,000 fire incidents is about the same.Casualties per 1,000 incidents in Darien, IL compared to nearest cities:
(Note: Based on data for all years, including only cities with at least 500 fire incidents)
| Darien: | 12.9 |
| Willowbrook: | 14.9 |
| Burr Ridge: | 14.3 |
| Woodridge: | 19.9 |
| Westmont: | 21.2 |
| Downers Grove: | 21.9 |
| Hinsdale: | 15.1 |
| Lemont: | 8.4 |
| Lisle: | 26.1 |
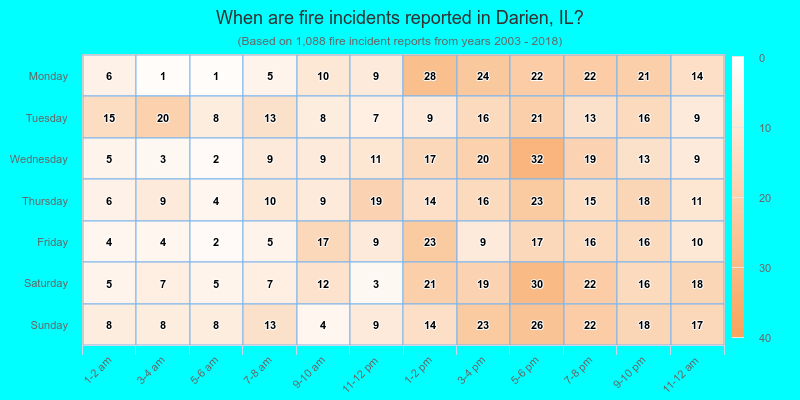
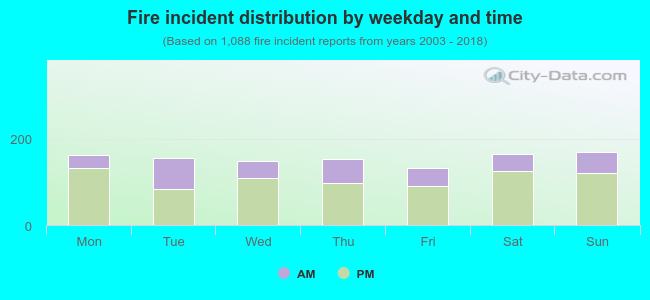 30.2% incidents where reported in the morning and 69.8% in the evening. The most fires (15.6%) took place on Sunday, and the least (12.1%) on Friday.
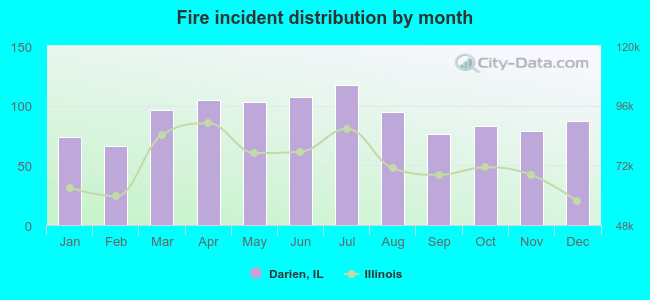 Based on the 1,088 fires from years 2003 - 2018 most fires (10.8%) took place during July, and the least (6.1%) in February.
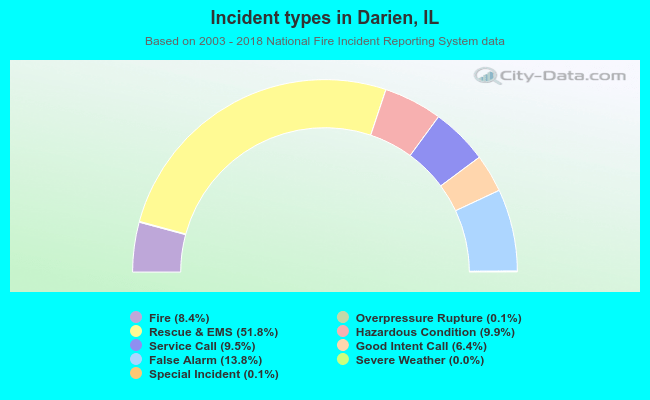 Out of all 13,010 cases reported during the years 2003 - 2018, the most belonged to the categories: Rescue & EMS (51.8%), False Alarm (13.8%), and Hazardous Condition (9.9%).
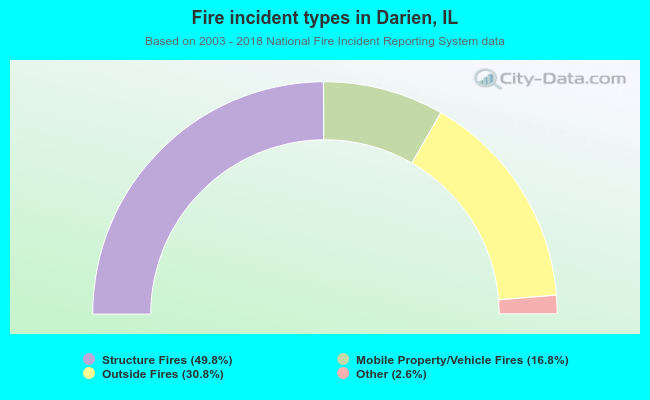 When looking into fire subcategories, the most reports belonged to: Structure Fires (49.8%), and Outside Fires (30.8%).