Clementon: Fire Incidents, New Jersey (NJ)
Where are fire incidents reported in Clementon, NJ
Something went wrong! Please refresh the page.
| Fire incidents reported | |
|---|---|
| Sreet name | Count |
| GIBBSBORO RD | 648 |
| BLACKWOOD CLEMENTON RD | 200 |
| WHITE HORSE PIKE | 174 |
| BERLIN RD | 142 |
| WHITE HORSE | 88 |
| BRAND AVE | 72 |
| BLACKWOOD RD | 64 |
| BRAND | 40 |
| ERIAL RD | 38 |
| LINCOLN AVE | 34 |
| NEW FREEDOM RD | 32 |
| LACASCATA | 28 |
| LINCOLN | 22 |
| LITTLE GLOUCESTER RD | 22 |
| COVENTRY CT | 20 |
| OHIO AVE | 20 |
| BROADACRES DR | 16 |
| KNIGHT | 16 |
| ATLANTIC | 14 |
| HIGHLAND | 14 |
| AUDUBON AVE | 12 |
| BARRY PL | 12 |
| BIRCH RD | 12 |
| CHELSEA CIR | 12 |
| CHEWS LANDING RD | 12 |
| MEEHAN BLVD | 12 |
| OHIO | 12 |
| CEDAR LN | 10 |
| CLEMENTON | 10 |
| DAVIS AVE | 10 |
2003 - 2018 National Fire Incident Reporting System (NFIRS) incidents
- Incident types reported to NFIRS in Clementon, NJ
- 1,25333.5%Hazardous Condition
- 1,22632.8%Fire
- 51613.8%Good Intent Call
- 37210.0%False Alarm
- 1844.9%Service Call
- 1804.8%Rescue & EMS
- 40.1%Overpressure Rupture
- Fire incident types reported to NFIRS in Clementon, NJ
- 83468.0%Structure Fires
- 28223.0%Outside Fires
- 988.0%Mobile Property/Vehicle Fires
- 121.0%Other
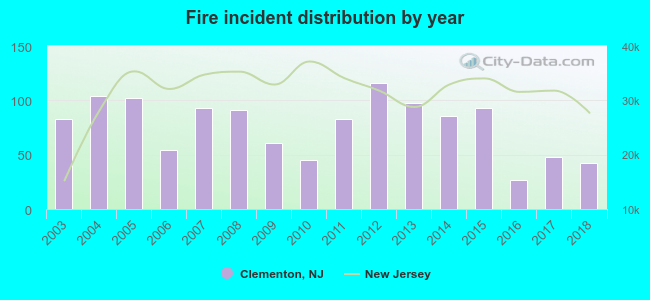 Based on the data from the years 2003 - 2018 the average number of fire incidents per year is 77. The highest number of fires - 116 took place in 2012, and the least - 27 in 2016. The data has a dropping trend.
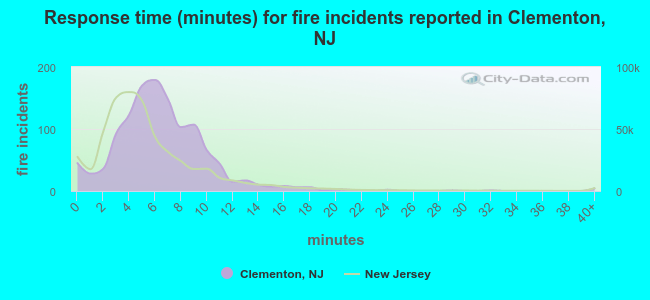 The median response time based on all reported fire incidents is 6 minutes. This is comparable to the state median value.
The median response time in Clementon, NJ compared to nearest cities:
(Note: Based on data for all years, including only cities with at least 500 fire incidents)
| Clementon: | 6 minutes |
| Lindenwold: | 7 minutes |
| Pine Hill: | 6 minutes |
| Berlin: | 5 minutes |
| Blackwood: | 6 minutes |
| Magnolia: | 6 minutes |
| Turnersville: | 7 minutes |
| Barrington: | 7 minutes |
| Runnemede: | 7 minutes |
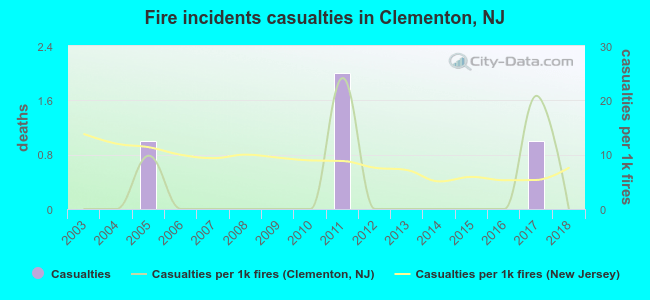 Based on the reports from the years 2003 - 2018 the average number of fire-related yearly casualties is 0. The highest number of casualties - 2 took place in 2011, and the lowest - 0 in 2003. The data has a constant trend.
The average number of injuries per 1,000 fire incidents is 3. This indicator was the highest - 24 in 2011, and the lowest 0 in 2003. The trend for injuries per 1,000 fires is constant. Compared to the New Jersey value the number of casualties per 1,000 fire incidents is much lower.
Based on the reports from the years 2003 - 2018 the average number of fire-related yearly casualties is 0. The highest number of casualties - 2 took place in 2011, and the lowest - 0 in 2003. The data has a constant trend.
The average number of injuries per 1,000 fire incidents is 3. This indicator was the highest - 24 in 2011, and the lowest 0 in 2003. The trend for injuries per 1,000 fires is constant. Compared to the New Jersey value the number of casualties per 1,000 fire incidents is much lower.Casualties per 1,000 incidents in Clementon, NJ compared to nearest cities:
(Note: Based on data for all years, including only cities with at least 500 fire incidents)
| Clementon: | 3.3 |
| Lindenwold: | 4.1 |
| Pine Hill: | 0.7 |
| Berlin: | 0.0 |
| Blackwood: | 7.5 |
| Magnolia: | 5.7 |
| Turnersville: | 13.6 |
| Barrington: | 0.0 |
| Runnemede: | 0.0 |
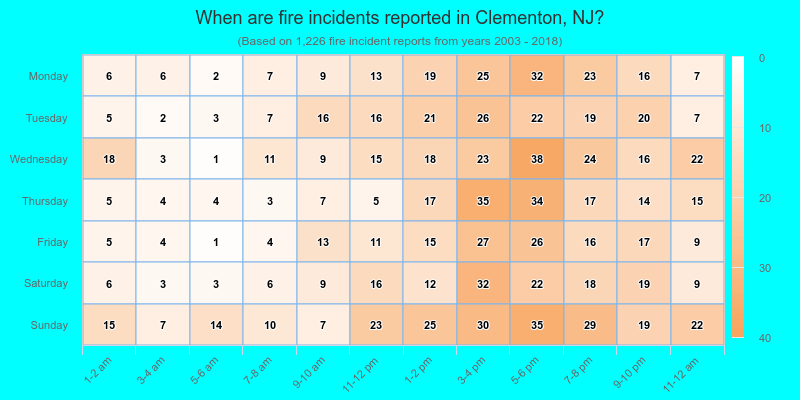
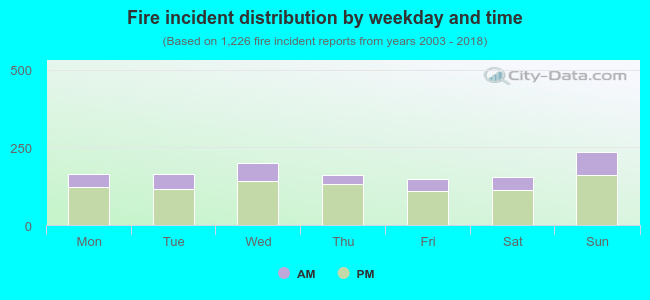 27.2% incidents where reported in the morning and 72.8% in the evening. The most fires (19.2%) took place on Sunday, and the least (12.1%) on Friday.
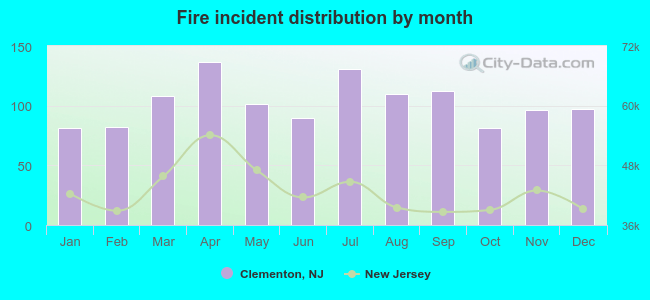 According to the 1,226 fire incident reports from years 2003 - 2018 most fires (11.2%) took place during April, and the least (6.6%) in January.
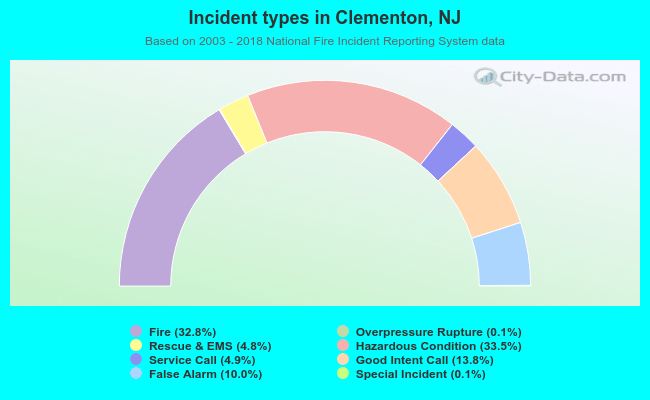 Out of all 3,737 cases reported during the years 2003 - 2018, the most belonged to the categories: Hazardous Condition (33.5%), Fire (32.8%), and Good Intent Call (13.8%).
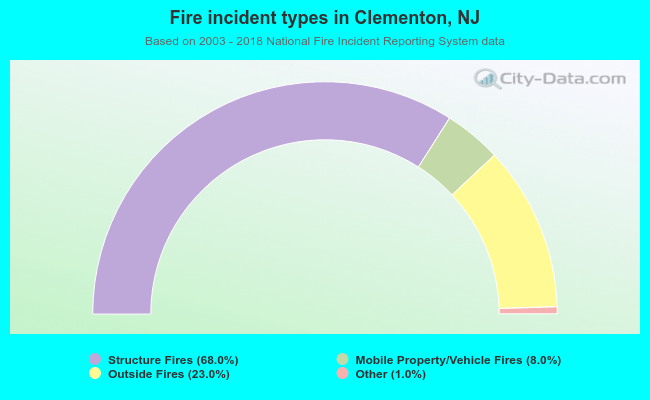 When looking into fire subcategories, the most reports belonged to: Structure Fires (68.0%), and Outside Fires (23.0%).