Pine Hill: Fire Incidents, New Jersey (NJ)
Where are fire incidents reported in Pine Hill, NJ
Something went wrong! Please refresh the page.
| Fire incidents reported | |
|---|---|
| Sreet name | Count |
| BRANCH | 270 |
| BLACKWOOD CLEMENTON RD | 192 |
| WEST BRANCH AVE | 168 |
| BRANCH AVE | 162 |
| ERIAL RD | 68 |
| TURNERSVILLE RD | 64 |
| HICKSTOWN RD | 44 |
| COUNTRY CLUB RD | 38 |
| DIAMOND | 36 |
| MILLSTREAM RD | 36 |
| ESTATES RD | 32 |
| POPLAR | 32 |
| TURNERVILLE RD | 32 |
| WILSON RD | 32 |
| BERLIN CROSS KEYS RD | 30 |
| CROSS KEYS RD | 30 |
| POPLAR AVE | 28 |
| BLACKWOOD - CLEMENTON RD | 26 |
| CRANFORD RD | 26 |
| BLACKWOOD RD | 24 |
| GRANT LN | 24 |
| 3RD AVE | 22 |
| CLOVERDALE | 22 |
| FRANKLIN | 22 |
| RAMBLEWOOD DR | 22 |
| DAVIS | 20 |
| 3RD | 18 |
| FRANKLIN AVE | 18 |
| GOLFVIEW CT | 18 |
| GRANT LANE | 18 |
2003 - 2018 National Fire Incident Reporting System (NFIRS) incidents
- Incident types reported to NFIRS in Pine Hill, NJ
- 1,36427.5%Hazardous Condition
- 1,34827.2%Fire
- 67513.6%Good Intent Call
- 67113.5%Rescue & EMS
- 4879.8%False Alarm
- 3396.8%Service Call
- 280.6%Overpressure Rupture
- 280.6%Severe Weather
- 130.3%Special Incident
- Fire incident types reported to NFIRS in Pine Hill, NJ
- 73054.2%Structure Fires
- 52138.6%Outside Fires
- 654.8%Mobile Property/Vehicle Fires
- 322.4%Other
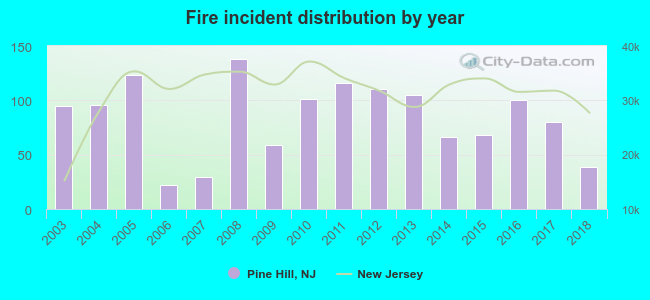 Based on the data from the years 2003 - 2018 the average number of fire incidents per year is 84. The highest number of fire incidents - 138 took place in 2008, and the least - 22 in 2006. The data has a declining trend.
The average number of yearly fire incidents per 10k residents in Pine Hill, NJ compared to nearest cities:
(Note: Based on data for the last 3 years, including only cities with population 5,000 and above)
| Pine Hill: | 69.8 |
| Lindenwold: | 36.9 |
| Berlin: | 33.1 |
| Stratford: | 51.4 |
| Somerdale: | 85.5 |
| Runnemede: | 46.2 |
| Williamstown: | 24.6 |
| Barrington: | 61.0 |
| Haddon Heights: | 29.4 |
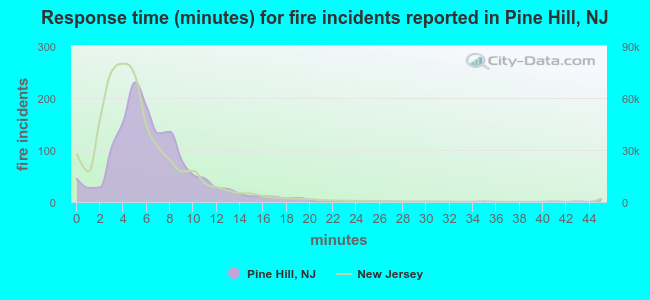 The median response time based on all reported fire incidents is 6 minutes. This is close to the state median value.
The median response time in Pine Hill, NJ compared to nearest cities:
(Note: Based on data for all years, including only cities with at least 500 fire incidents)
| Pine Hill: | 6 minutes |
| Clementon: | 6 minutes |
| Lindenwold: | 7 minutes |
| Berlin: | 5 minutes |
| Blackwood: | 6 minutes |
| Turnersville: | 7 minutes |
| Magnolia: | 6 minutes |
| Runnemede: | 7 minutes |
| Williamstown: | 8 minutes |
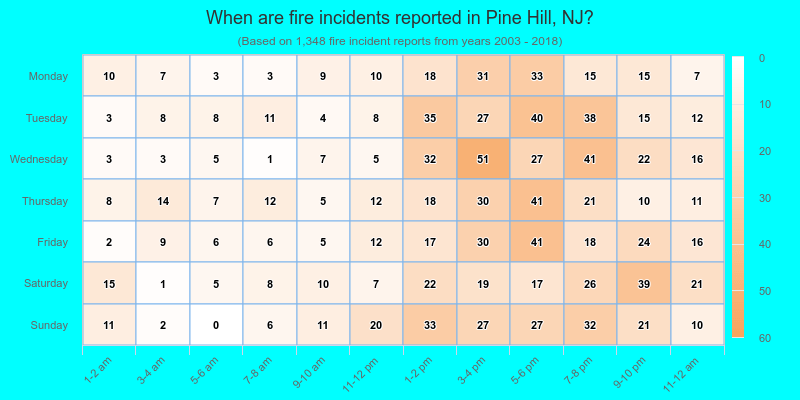
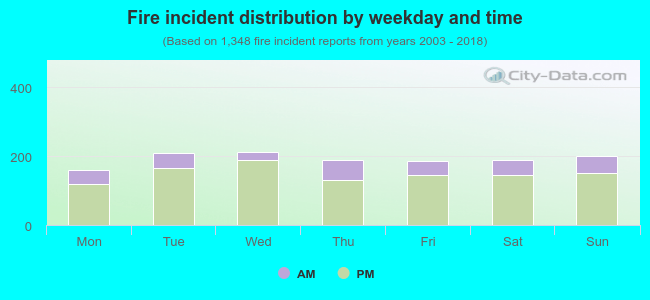 22.4% incidents where reported in the morning and 77.6% in the evening. The most fires (15.8%) took place on Wednesday, and the least (11.9%) on Monday.
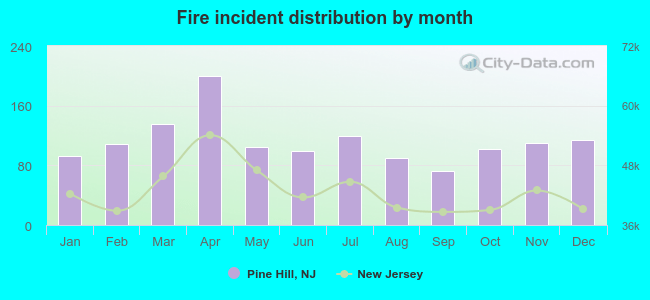 Based on the 1,348 incident reports from years 2003 - 2018 most fires (14.8%) took place during April, and the least (5.3%) in September.
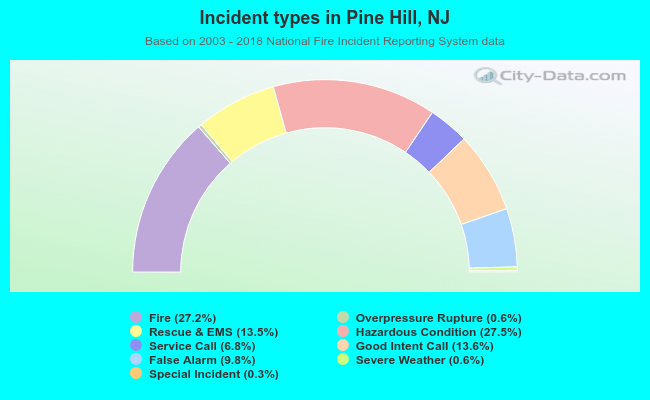 Out of all 4,953 cases reported during the years 2003 - 2018, the most belonged to the categories: Hazardous Condition (27.5%), Fire (27.2%), and Good Intent Call (13.6%).
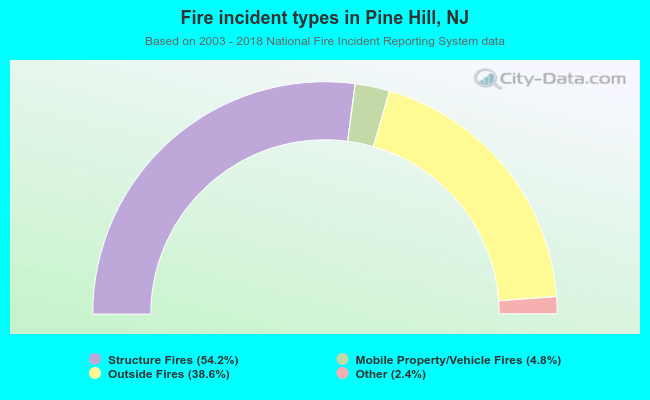 When looking into fire subcategories, the most reports belonged to: Structure Fires (54.2%), and Outside Fires (38.6%).