Cleveland Heights: Fire Incidents, Ohio (OH)
Where are fire incidents reported in Cleveland Heights, OH
Something went wrong! Please refresh the page.
| Fire incidents reported | |
|---|---|
| Sreet name | Count |
| MAYFIELD RD | 282 |
| NOBLE RD | 188 |
| LEE RD | 142 |
| TAYLOR RD | 138 |
| CEDAR RD | 136 |
| EUCLID HEIGHTS BLVD | 116 |
| MONTICELLO BLVD | 112 |
| COVENTRY RD | 100 |
| DERBYSHIRE RD | 100 |
| OVERLOOK RD | 96 |
| SUPERIOR RD | 92 |
| SEVERANCE CIR | 84 |
| BERKSHIRE RD | 64 |
| MURRAY HILL RD | 54 |
| QUILLIAMS RD | 48 |
| NELA VIEW RD | 46 |
| BENDEMEER RD | 44 |
| BERKELEY RD | 42 |
| HELMSDALE RD | 42 |
| BLANCHE AVE | 40 |
| DESOTA AVE | 40 |
| MEADOWBROOK BLVD | 40 |
| CLEVELAND HEIGHTS BLVD | 38 |
| WASHINGTON BLVD | 38 |
| WARRENSVILLE CENTER RD | 36 |
| YELLOWSTONE RD | 36 |
| FAIRMOUNT BLVD | 34 |
| HAMPSHIRE RD | 34 |
| SELWYN RD | 34 |
| CUMBERLAND RD | 32 |
| Other | 159 |
2002 - 2018 National Fire Incident Reporting System (NFIRS) incidents
- Incident types reported to NFIRS in Cleveland Heights, OH
- 24,49867.3%Rescue & EMS
- 3,78110.4%Hazardous Condition
- 3,0828.5%False Alarm
- 2,4876.8%Fire
- 1,2903.5%Service Call
- 9352.6%Good Intent Call
- 2680.7%Special Incident
- Fire incident types reported to NFIRS in Cleveland Heights, OH
- 1,77571.4%Structure Fires
- 39816.0%Outside Fires
- 29211.7%Mobile Property/Vehicle Fires
- 220.9%Other
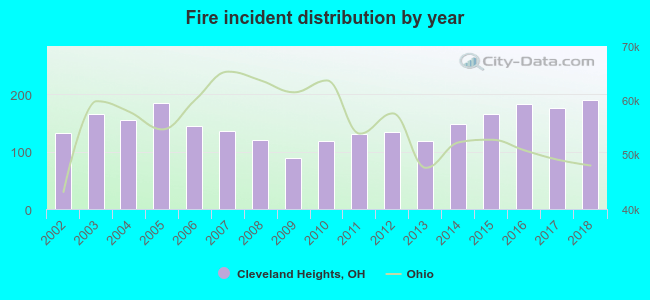 Based on the data from the years 2002 - 2018 the average number of fire incidents per year is 146. The highest number of fires - 189 took place in 2018, and the least - 88 in 2009. The data has a growing trend.
The average number of yearly fire incidents per 10k residents in Cleveland Heights, OH compared to nearest cities:
(Note: Based on data for the last 3 years, including only cities with population 5,000 and above)
| Cleveland Heights: | 40.4 |
| University Heights: | 50.2 |
| East Cleveland: | 85.7 |
| South Euclid: | 30.5 |
| Shaker Heights: | 34.3 |
| Beachwood: | 34.5 |
| Lyndhurst: | 28.4 |
| Richmond Heights: | 52.1 |
| Warrensville Heights: | 5.3 |
 The median response time based on all reported fire incidents is 5 minutes. This is lower compared to the state median value.
The median response time in Cleveland Heights, OH compared to nearest cities:
(Note: Based on data for all years, including only cities with at least 500 fire incidents)
| Cleveland Heights: | 5 minutes |
| University Heights: | 5 minutes |
| East Cleveland: | 3 minutes |
| South Euclid: | 6 minutes |
| Shaker Heights: | 4 minutes |
| Beachwood: | 4 minutes |
| Lyndhurst: | 5 minutes |
| Mayfield Heights: | 4 minutes |
| Cleveland: | 5 minutes |
 According to the reports from the years 2002 - 2018 the average number of fire-related casualties per year is 2. The highest number of injuries - 9 took place in 2015, and the lowest - 0 in 2002. The data has a rising trend.
The average number of injuries per 1,000 fires is 15. This indicator was the highest - 54 in 2015, and the lowest 0 in 2002. The trend for casualties per 1,000 incidents is increasing. Compared to the state value the number of injuries per 1,000 fires is similar.
According to the reports from the years 2002 - 2018 the average number of fire-related casualties per year is 2. The highest number of injuries - 9 took place in 2015, and the lowest - 0 in 2002. The data has a rising trend.
The average number of injuries per 1,000 fires is 15. This indicator was the highest - 54 in 2015, and the lowest 0 in 2002. The trend for casualties per 1,000 incidents is increasing. Compared to the state value the number of injuries per 1,000 fires is similar.Casualties per 1,000 incidents in Cleveland Heights, OH compared to nearest cities:
(Note: Based on data for all years, including only cities with at least 500 fire incidents)
| Cleveland Heights: | 16.1 |
| University Heights: | 17.9 |
| East Cleveland: | 13.0 |
| South Euclid: | 35.4 |
| Shaker Heights: | 49.0 |
| Beachwood: | 2.9 |
| Lyndhurst: | 12.4 |
| Mayfield Heights: | 5.3 |
| Cleveland: | 17.3 |
 31.4% incidents where reported in the morning and 68.6% in the evening. The most fires (16.8%) took place on Sunday, and the least (12.1%) on Thursday.
 According to the 2,487 reports from years 2002 - 2018 most fires (10.3%) took place during April, and the least (6.5%) in January.
 Out of all 36,386 cases reported during the years 2002 - 2018, the most belonged to the categories: Rescue & EMS (67.3%), Hazardous Condition (10.4%), and False Alarm (8.5%).
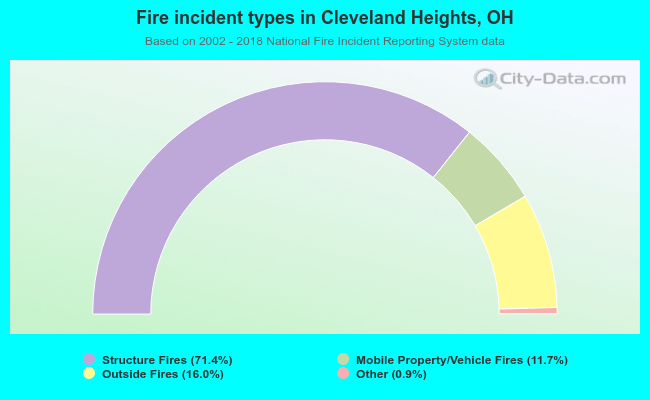 When looking into fire subcategories, the most incidents belonged to: Structure Fires (71.4%), and Outside Fires (16.0%).