Shaker Heights: Fire Incidents, Ohio (OH)
Where are fire incidents reported in Shaker Heights, OH
Something went wrong! Please refresh the page.
| Fire incidents reported | |
|---|---|
| Sreet name | Count |
| VAN AKEN BLVD | 146 |
| WARRENSVILLE CENTER RD | 100 |
| CHAGRIN BLVD | 98 |
| LEE RD | 64 |
| SHAKER BLVD | 62 |
| AVALON RD | 38 |
| VAN AKEN BLVD | 38 |
| WARRENSVILLE CENTER RD | 32 |
| DALEFORD RD | 30 |
| LOMOND BLVD | 28 |
| SCOTTSDALE BLVD | 28 |
| INGLESIDE RD | 26 |
| WINSLOW RD | 26 |
| FAIRHILL RD | 24 |
| FAIRHILL RD | 22 |
| CHAGRIN BL | 20 |
| MILVERTON RD | 20 |
| SHAKER BLVD | 20 |
| VAN AKEN | 20 |
| VAN AKEN BL | 20 |
| WOODLAND RD | 20 |
| CHADBOURNE RD | 18 |
| KEMPER RD | 18 |
| KEMPER RD | 18 |
| LYNNFIELD RD | 18 |
| NORMANDY RD | 18 |
| SHELBURNE RD | 18 |
| CHAGRIN BLVD | 16 |
| FERNWAY RD | 16 |
| SHAKER BL | 16 |
2002 - 2018 National Fire Incident Reporting System (NFIRS) incidents
- Incident types reported to NFIRS in Shaker Heights, OH
- 9,14053.0%Rescue & EMS
- 2,58215.0%Hazardous Condition
- 1,96211.4%False Alarm
- 1,5519.0%Service Call
- 1,0205.9%Fire
- 9225.4%Good Intent Call
- 250.1%Overpressure Rupture
- 220.1%Special Incident
- Fire incident types reported to NFIRS in Shaker Heights, OH
- 64062.7%Structure Fires
- 24824.3%Outside Fires
- 12612.4%Mobile Property/Vehicle Fires
- 60.6%Other
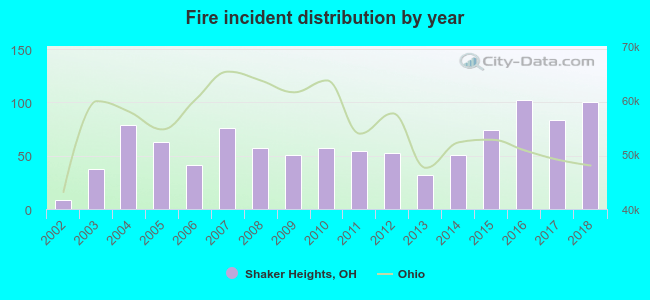 According to the data from the years 2002 - 2018 the average number of fires per year is 60. The highest number of reported fires - 102 took place in 2016, and the least - 8 in 2002. The data has a growing trend.
The average number of yearly fire incidents per 10k residents in Shaker Heights, OH compared to nearest cities:
(Note: Based on data for the last 3 years, including only cities with population 5,000 and above)
| Shaker Heights: | 34.3 |
| University Heights: | 50.2 |
| Cleveland Heights: | 40.4 |
| Beachwood: | 34.5 |
| Warrensville Heights: | 5.3 |
| South Euclid: | 30.5 |
| East Cleveland: | 85.7 |
| Pepper Pike: | 24.7 |
| Lyndhurst: | 28.4 |
 The median response time based on all reported fire incidents is 4 minutes. This is lower compared to the Ohio median value.
The median response time in Shaker Heights, OH compared to nearest cities:
(Note: Based on data for all years, including only cities with at least 500 fire incidents)
| Shaker Heights: | 4 minutes |
| University Heights: | 5 minutes |
| Cleveland Heights: | 5 minutes |
| Beachwood: | 4 minutes |
| South Euclid: | 6 minutes |
| East Cleveland: | 3 minutes |
| Lyndhurst: | 5 minutes |
| Garfield Heights: | 4 minutes |
| Mayfield Heights: | 4 minutes |
 According to the reports from the years 2002 - 2018 the average number of fire-related fatalities per year is 0. The highest number of deaths - 3 took place in 2007, and the lowest - 0 in 2002. The data has a constant trend.
 Based on the data from the years 2002 - 2018 the average number of fire-related casualties per year is 3. The highest number of casualties - 10 took place in 2006, and the lowest - 0 in 2002. The data has a rising trend.
The average number of injuries per 1,000 fire incidents is 51. This indicator was the highest - 244 in 2006, and the lowest 0 in 2002. The trend for injuries per 1,000 fires is rising. Compared to the state value the number of injuries per 1,000 fire incidents is much higher.
Based on the data from the years 2002 - 2018 the average number of fire-related casualties per year is 3. The highest number of casualties - 10 took place in 2006, and the lowest - 0 in 2002. The data has a rising trend.
The average number of injuries per 1,000 fire incidents is 51. This indicator was the highest - 244 in 2006, and the lowest 0 in 2002. The trend for injuries per 1,000 fires is rising. Compared to the state value the number of injuries per 1,000 fire incidents is much higher.Casualties per 1,000 incidents in Shaker Heights, OH compared to nearest cities:
(Note: Based on data for all years, including only cities with at least 500 fire incidents)
| Shaker Heights: | 49.0 |
| University Heights: | 17.9 |
| Cleveland Heights: | 16.1 |
| Beachwood: | 2.9 |
| South Euclid: | 35.4 |
| East Cleveland: | 13.0 |
| Lyndhurst: | 12.4 |
| Garfield Heights: | 16.2 |
| Mayfield Heights: | 5.3 |
 30.0% incidents where reported in the morning and 70.0% in the evening. The most fires (17.3%) took place on Tuesday, and the least (11.6%) on Thursday.
 Based on the 1,020 fire incidents from years 2002 - 2018 most fires (10.3%) took place during May, and the least (6.0%) in March.
 Out of all 17,230 cases reported during the years 2002 - 2018, the most belonged to the categories: Rescue & EMS (53.0%), Hazardous Condition (15.0%), and False Alarm (11.4%).
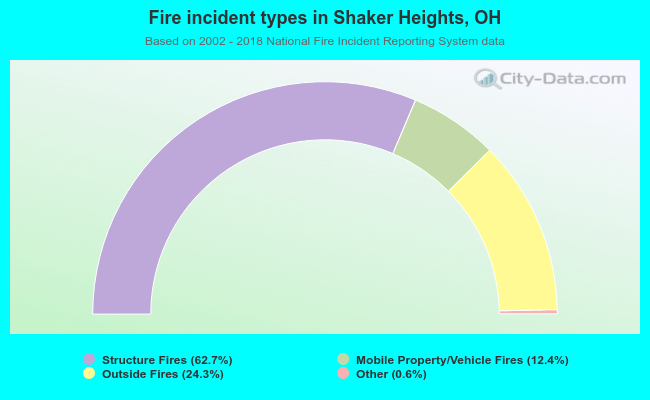 When looking into fire subcategories, the most reports belonged to: Structure Fires (62.7%), and Outside Fires (24.3%).