Cleveland: Fire Incidents, Mississippi (MS)
Where are fire incidents reported in Cleveland, MS
Something went wrong! Please refresh the page.
| Fire incidents reported | |
|---|---|
| Sreet name | Count |
| DAVIS AVE | 190 |
| WHITE ST | 98 |
| 8 HWY | 72 |
| CHRISMAN AVE | 72 |
| NORTH ST | 44 |
| ROSEMARY RD | 44 |
| ALOE | 38 |
| HWY 61 | 34 |
| OLD RULEVILLE RD | 34 |
| CROSBY RD | 32 |
| CROSS ST | 32 |
| GLASSCO | 30 |
| SHAMROCK DR | 28 |
| 61 HWY | 26 |
| SHAMROCK | 26 |
| BISHOP RD | 24 |
| CHURCH ST | 24 |
| NOBLIN RD | 24 |
| RUBY ST | 24 |
| SMITH RD | 24 |
| BAYOU AVE | 22 |
| MEMORIAL DR | 22 |
| NORTH BAYOU | 22 |
| NORTH STREET | 22 |
| CARPENTER ST | 20 |
| DAVIS | 20 |
| FIORANELLI DR | 20 |
| HWY 8 | 20 |
| PEARL ST | 20 |
| SHARPE AVE | 20 |
| Other | 403 |
2002 - 2018 National Fire Incident Reporting System (NFIRS) incidents
- Incident types reported to NFIRS in Cleveland, MS
- 1,53148.7%Fire
- 70122.3%Hazardous Condition
- 50115.9%False Alarm
- 1946.2%Good Intent Call
- 1083.4%Rescue & EMS
- 953.0%Service Call
- 90.3%Overpressure Rupture
- 50.2%Special Incident
- Fire incident types reported to NFIRS in Cleveland, MS
- 58238.0%Structure Fires
- 50633.1%Outside Fires
- 32821.4%Mobile Property/Vehicle Fires
- 1157.5%Other
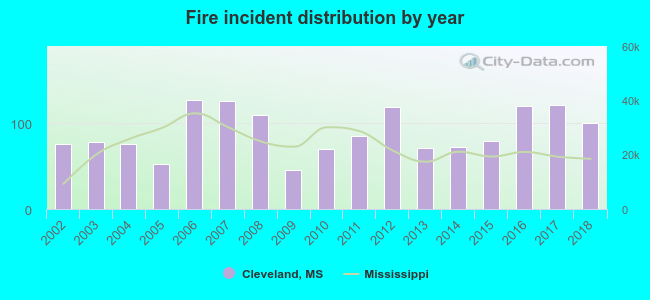 According to the data from the years 2002 - 2018 the average number of fire incidents per year is 90. The highest number of fires - 127 took place in 2006, and the least - 46 in 2009. The data has a rising trend.
The average number of yearly fire incidents per 10k residents in Cleveland, MS compared to nearest cities:
(Note: Based on data for the last 3 years, including only cities with population 5,000 and above)
| Cleveland: | 91.8 |
| Indianola: | 80.7 |
| Greenville: | 93.1 |
| Clarksdale: | 74.5 |
| Greenwood: | 73.3 |
| Grenada: | 133.0 |
 The median response time based on all reported fire incidents is 3 minutes. This is much lower compared to the state median value.
The median response time in Cleveland, MS compared to nearest cities:
(Note: Based on data for all years, including only cities with at least 500 fire incidents)
| Cleveland: | 3 minutes |
| Shelby: | 7 minutes |
| Indianola: | 4 minutes |
| Leland: | 3 minutes |
| Greenville: | 3 minutes |
| Clarksdale: | 4 minutes |
| Greenwood: | 5 minutes |
| Hollandale: | 8 minutes |
| Lambert: | 9 minutes |
 According to the reports from the years 2002 - 2018 the average number of fire-related yearly casualties is 1. The highest number of reported casualties - 3 took place in 2009, and the lowest - 0 in 2002. The data has a rising trend.
The average number of injuries per 1,000 fire incidents is 8. This indicator was the highest - 65 in 2009, and the lowest 0 in 2002. The trend for casualties per 1,000 fire incidents is increasing. Compared to the Mississippi value the number of casualties per 1,000 fire incidents is much higher.
According to the reports from the years 2002 - 2018 the average number of fire-related yearly casualties is 1. The highest number of reported casualties - 3 took place in 2009, and the lowest - 0 in 2002. The data has a rising trend.
The average number of injuries per 1,000 fire incidents is 8. This indicator was the highest - 65 in 2009, and the lowest 0 in 2002. The trend for casualties per 1,000 fire incidents is increasing. Compared to the Mississippi value the number of casualties per 1,000 fire incidents is much higher.Casualties per 1,000 incidents in Cleveland, MS compared to nearest cities:
(Note: Based on data for all years, including only cities with at least 500 fire incidents)
| Cleveland: | 7.2 |
| Shelby: | 1.7 |
| Indianola: | 1.9 |
| Leland: | 0.0 |
| Greenville: | 9.2 |
| Clarksdale: | 3.1 |
| Greenwood: | 0.9 |
| Hollandale: | 3.6 |
| Lambert: | 3.9 |
 34.5% incidents where reported in the morning and 65.5% in the evening. The most fires (16.3%) took place on Saturday, and the least (13.2%) on Tuesday.
 According to the 1,531 fire incidents from years 2002 - 2018 most fires (10.6%) took place during August, and the least (6.5%) in February.
 Out of all 3,145 cases reported during the years 2002 - 2018, the most belonged to the categories: Fire (48.7%), Hazardous Condition (22.3%), and False Alarm (15.9%).
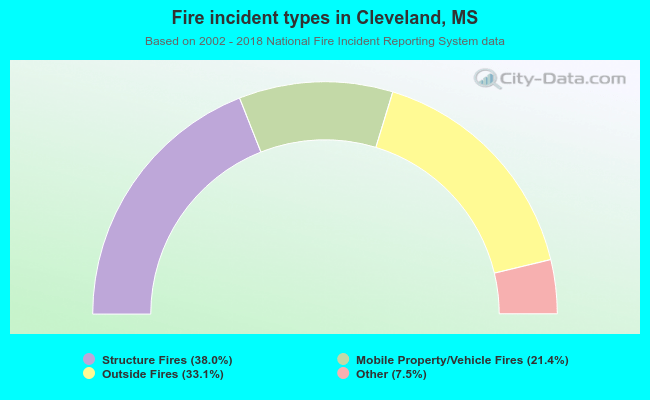 When looking into fire subcategories, the most reports belonged to: Structure Fires (38.0%), and Outside Fires (33.1%).