Indianola: Fire Incidents, Mississippi (MS)
Where are fire incidents reported in Indianola, MS
Something went wrong! Please refresh the page.
| Fire incidents reported | |
|---|---|
| Sreet name | Count |
| HIGHWAY 82 | 68 |
| HIGHWAY 82 HWY | 60 |
| 82 HWY | 54 |
| KINLOCK RD | 48 |
| ROOSEVELT ST | 48 |
| COX ST | 44 |
| HWY 82 WEST | 38 |
| HWY 82 EAST | 32 |
| WESTSIDE AVE | 30 |
| WIGGINS RD | 30 |
| AIRPORT RD | 28 |
| BB KING RD | 28 |
| BEAVERDAM RD | 28 |
| BIRDSONG ST | 28 |
| HOOVER ST | 28 |
| OAK ST | 28 |
| CHANDLER ST | 26 |
| GRESHAM ST | 24 |
| SECOND ST | 22 |
| CHURCH ST | 20 |
| CURTIS ST | 20 |
| GILLESPIE DR | 20 |
| BRICKYARD RD | 18 |
| CLEVELAND ST | 18 |
| FAISON AVE | 18 |
| JEFFERSON ST | 18 |
| HANNAH AVE | 16 |
| HIGHWAY 49 | 16 |
| HWY 448 | 16 |
| JACKSON ST | 16 |
| Other | 686 |
2002 - 2018 National Fire Incident Reporting System (NFIRS) incidents
- Incident types reported to NFIRS in Indianola, MS
- 1,57463.9%Fire
- 44418.0%Hazardous Condition
- 1506.1%Service Call
- 1445.8%False Alarm
- 793.2%Good Intent Call
- 642.6%Rescue & EMS
- 40.2%Overpressure Rupture
- Fire incident types reported to NFIRS in Indianola, MS
- 63740.5%Structure Fires
- 53934.2%Outside Fires
- 36122.9%Mobile Property/Vehicle Fires
- 372.4%Other
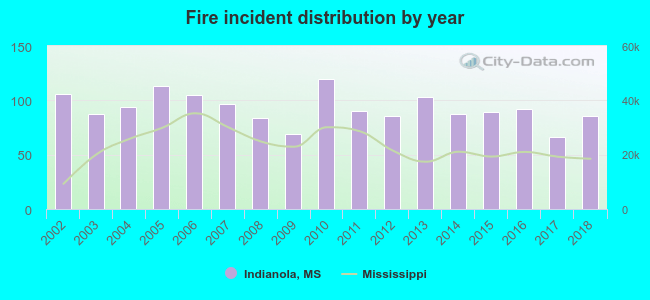 According to the data from the years 2002 - 2018 the average number of fire incidents per year is 93. The highest number of reported fire incidents - 120 took place in 2010, and the least - 66 in 2017. The data has a dropping trend.
The average number of yearly fire incidents per 10k residents in Indianola, MS compared to nearest cities:
(Note: Based on data for the last 3 years, including only cities with population 5,000 and above)
| Indianola: | 80.7 |
| Cleveland: | 91.8 |
| Greenville: | 93.1 |
| Greenwood: | 73.3 |
| Yazoo City: | 108.5 |
| Clarksdale: | 74.5 |
| Grenada: | 133.0 |
 The median response time based on all reported fire incidents is 4 minutes. This is lower than the Mississippi median value.
The median response time in Indianola, MS compared to nearest cities:
(Note: Based on data for all years, including only cities with at least 500 fire incidents)
| Indianola: | 4 minutes |
| Leland: | 3 minutes |
| Belzoni: | 5 minutes |
| Cleveland: | 3 minutes |
| Hollandale: | 8 minutes |
| Greenville: | 3 minutes |
| Greenwood: | 5 minutes |
| Tchula: | 11 minutes |
| Shelby: | 7 minutes |
 According to the data from the years 2002 - 2018 the average number of fire-related yearly deaths is 0. The highest number of deaths - 2 took place in 2010, and the lowest - 0 in 2002. The data has a rising trend.
 39.2% incidents where reported in the morning and 60.8% in the evening. The most fires (16.8%) took place on Monday, and the least (12.6%) on Sunday.
 Based on the 1,574 fires from years 2002 - 2018 most fires (10.9%) took place during October, and the least (6.2%) in November.
 Out of all 2,462 cases reported during the years 2002 - 2018, the most belonged to the categories: Fire (63.9%), Hazardous Condition (18.0%), and Service Call (6.1%).
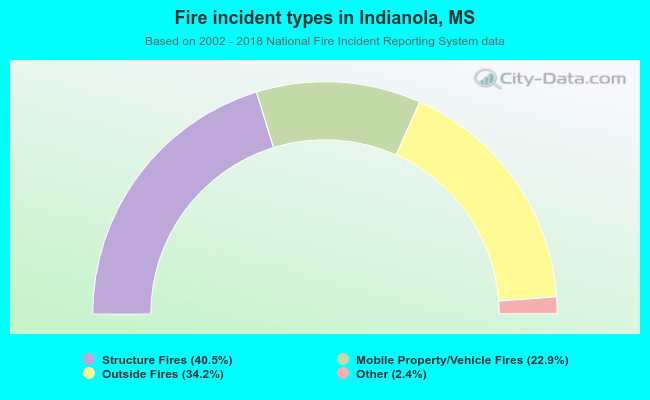 When looking into fire subcategories, the most incidents belonged to: Structure Fires (40.5%), and Outside Fires (34.2%).