Clinton: Fire Incidents, New Jersey (NJ)
Where are fire incidents reported in Clinton, NJ
Something went wrong! Please refresh the page.
|
| |||||||||||||||||||||||||||||||||||||||||||||||||||||||||||||||||||||||||||||||||||||||||||||||||||||||||||||
2002 - 2018 National Fire Incident Reporting System (NFIRS) incidents
- Incident types reported to NFIRS in Clinton, NJ
- 71431.1%Fire
- 56624.6%Hazardous Condition
- 34615.1%Good Intent Call
- 30813.4%False Alarm
- 29012.6%Rescue & EMS
- 723.1%Service Call
- Fire incident types reported to NFIRS in Clinton, NJ
- 43961.5%Structure Fires
- 13619.0%Outside Fires
- 11616.2%Mobile Property/Vehicle Fires
- 233.2%Other
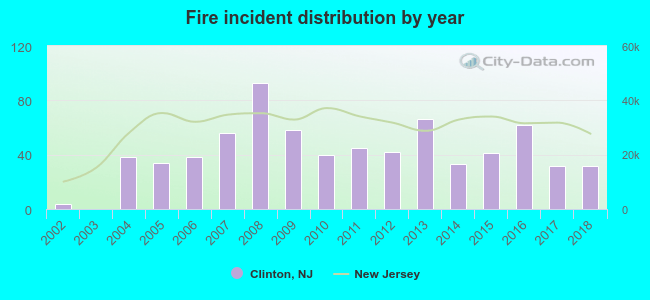 According to the data from the years 2002 - 2018 the average number of fires per year is 42. The highest number of reported fire incidents - 93 took place in 2008, and the least - 0 in 2003. The data has a rising trend.
 The median response time based on all reported fire incidents is 8 minutes. This is higher than the state median value.
The median response time in Clinton, NJ compared to nearest cities:
(Note: Based on data for all years, including only cities with at least 500 fire incidents)
| Clinton: | 8 minutes |
| Glen Gardner: | 9 minutes |
| Asbury: | 7 minutes |
| Flemington: | 10 minutes |
| Washington: | 9 minutes |
| Long Valley: | 10 minutes |
| Phillipsburg: | 5 minutes |
| Hackettstown: | 6 minutes |
| Somerville: | 3 minutes |
 32.4% incidents where reported in the morning and 67.6% in the evening. The most fires (17.9%) took place on Sunday, and the least (10.1%) on Wednesday.
 According to the 714 fire incident reports from years 2002 - 2018 most fires (11.5%) took place during November, and the least (5.0%) in February.
 Out of all 2,298 cases reported during the years 2002 - 2018, the most belonged to the categories: Fire (31.1%), Rescue & EMS (24.6%), and Service Call (15.1%).
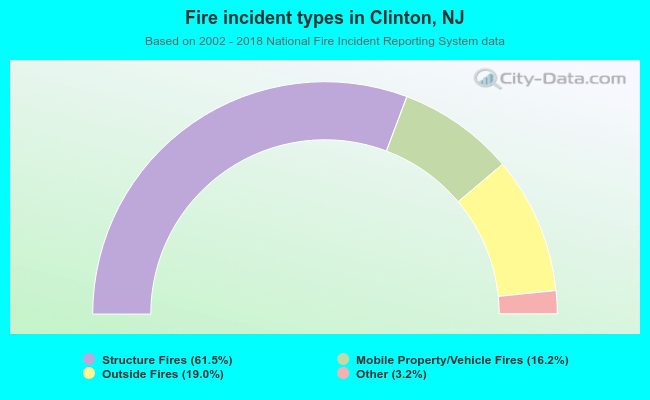 When looking into fire subcategories, the most reports belonged to: Structure Fires (61.5%), and Outside Fires (19.0%).