Washington: Fire Incidents, New Jersey (NJ)
Where are fire incidents reported in Washington, NJ
Something went wrong! Please refresh the page.
| Fire incidents reported | |
|---|---|
| Sreet name | Count |
| WASHINGTON AVE | 230 |
| ROUTE 31 | 56 |
| BRASS CASTLE RD | 44 |
| BELVIDERE AVE | 36 |
| ROUTE 31 HWY | 30 |
| 31 RT | 26 |
| CEMETERY HILL RD | 26 |
| BROAD ST | 24 |
| JACKSON AVE | 24 |
| TAYLOR ST | 24 |
| YOUMANS AVE | 24 |
| LINCOLN AVE | 22 |
| RYMON RD | 22 |
| SPRINGTOWN RD | 22 |
| ASBURY ANDERSON RD | 20 |
| BOWERSTOWN RD | 20 |
| CARLTON AVE | 20 |
| MINE HILL RD | 20 |
| RAILROAD AVE | 20 |
| STATE HIGHWAY 31 HWY | 20 |
| STEWART ST | 20 |
| JONESTOWN RD | 18 |
| ROUTE 57 | 18 |
| WASHBURN AVE | 18 |
| HARTMANS CORNER RD | 16 |
| JACKSON VALLEY RD | 16 |
| NUNN AVE | 16 |
| PORT COLDEN RD | 16 |
| CHURCH ST | 14 |
| CHANGEWATER RD | 10 |
2002 - 2018 National Fire Incident Reporting System (NFIRS) incidents
- Incident types reported to NFIRS in Washington, NJ
- 1,02631.3%Hazardous Condition
- 88026.9%Fire
- 57117.4%False Alarm
- 37511.5%Rescue & EMS
- 2808.6%Good Intent Call
- 1103.4%Service Call
- 140.4%Special Incident
- 110.3%Severe Weather
- 60.2%Overpressure Rupture
- Fire incident types reported to NFIRS in Washington, NJ
- 49756.5%Structure Fires
- 18320.8%Outside Fires
- 10011.4%Mobile Property/Vehicle Fires
- 10011.4%Other
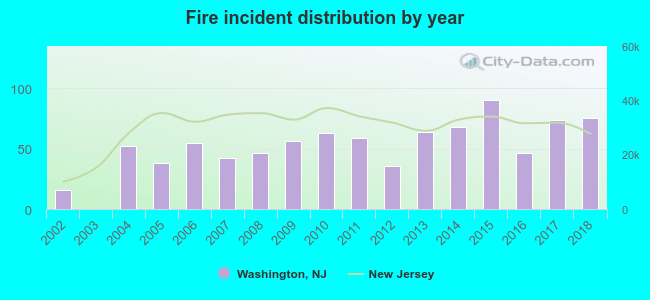 According to the data from the years 2002 - 2018 the average number of fires per year is 52. The highest number of reported fire incidents - 90 took place in 2015, and the least - 0 in 2003. The data has a growing trend.
The average number of yearly fire incidents per 10k residents in Washington, NJ compared to nearest cities:
(Note: Based on data for the last 3 years, including only cities with population 5,000 and above)
| Washington: | 100.5 |
| Hackettstown: | 32.5 |
| Phillipsburg: | 57.2 |
| Budd Lake: | 78.4 |
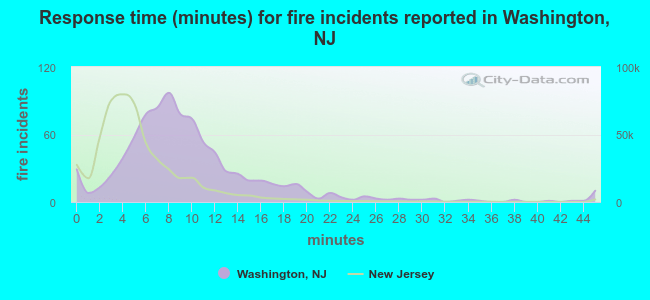 The median response time based on all reported fire incidents is 9 minutes. This is higher compared to the state median value.
The median response time in Washington, NJ compared to nearest cities:
(Note: Based on data for all years, including only cities with at least 500 fire incidents)
| Washington: | 9 minutes |
| Asbury: | 7 minutes |
| Glen Gardner: | 9 minutes |
| Clinton: | 8 minutes |
| Hackettstown: | 6 minutes |
| Long Valley: | 10 minutes |
| Phillipsburg: | 5 minutes |
| Budd Lake: | 0 minutes |
| Flemington: | 10 minutes |
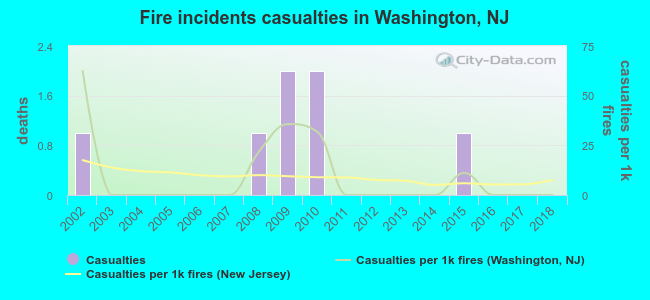 According to the data from the years 2002 - 2018 the average number of fire-related yearly casualties is 0. The highest number of reported casualties - 2 took place in 2009, and the lowest - 0 in 2003. The data has a decreasing trend.
The average number of injuries per 1,000 fire incidents is 10. This indicator was the highest - 63 in 2002, and the lowest 0 in 2003. The trend for casualties per 1,000 incidents is decreasing. Compared to the state value the number of injuries per 1,000 fire incidents is about the same.
According to the data from the years 2002 - 2018 the average number of fire-related yearly casualties is 0. The highest number of reported casualties - 2 took place in 2009, and the lowest - 0 in 2003. The data has a decreasing trend.
The average number of injuries per 1,000 fire incidents is 10. This indicator was the highest - 63 in 2002, and the lowest 0 in 2003. The trend for casualties per 1,000 incidents is decreasing. Compared to the state value the number of injuries per 1,000 fire incidents is about the same.Casualties per 1,000 incidents in Washington, NJ compared to nearest cities:
(Note: Based on data for all years, including only cities with at least 500 fire incidents)
| Washington: | 8.0 |
| Asbury: | 0.0 |
| Glen Gardner: | 1.7 |
| Clinton: | 1.4 |
| Hackettstown: | 0.0 |
| Long Valley: | 0.0 |
| Phillipsburg: | 32.3 |
| Budd Lake: | 2.3 |
| Flemington: | 2.2 |
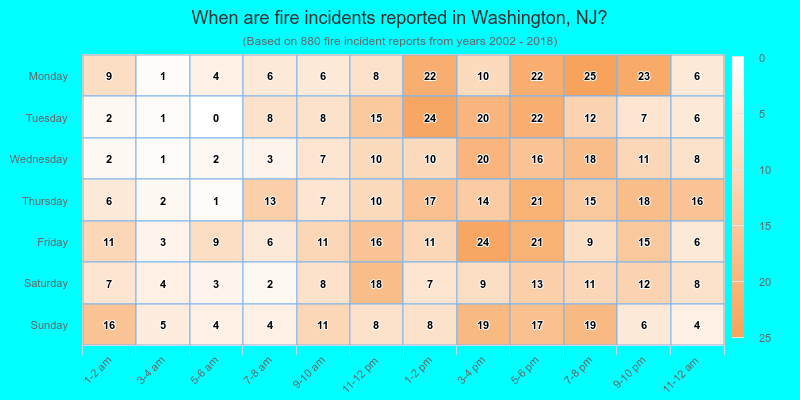
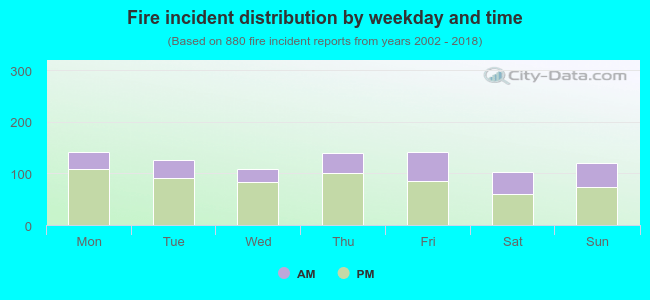 31.6% incidents where reported in the morning and 68.4% in the evening. The most fires (16.1%) took place on Monday, and the least (11.6%) on Saturday.
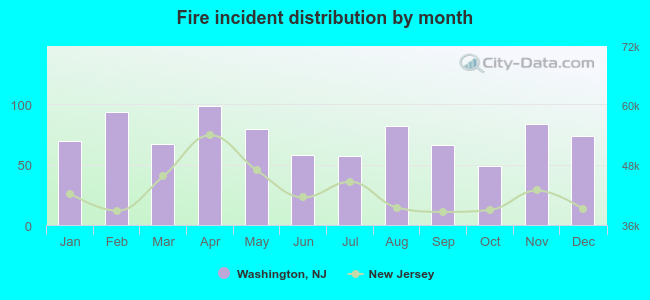 According to the 880 reports from years 2002 - 2018 most fires (11.3%) took place during April, and the least (5.6%) in October.
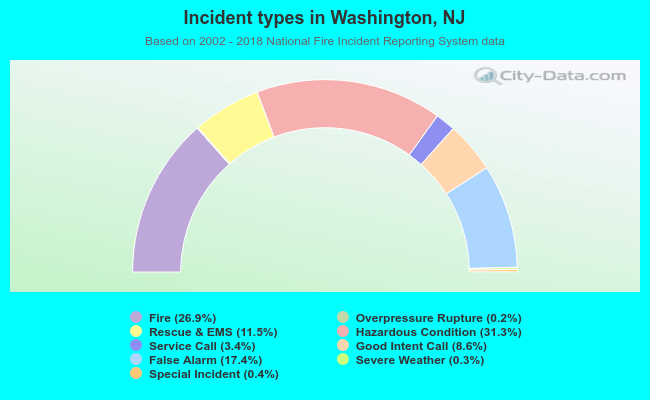 Out of all 3,273 cases reported during the years 2002 - 2018, the most belonged to the categories: Hazardous Condition (31.3%), Fire (26.9%), and False Alarm (17.4%).
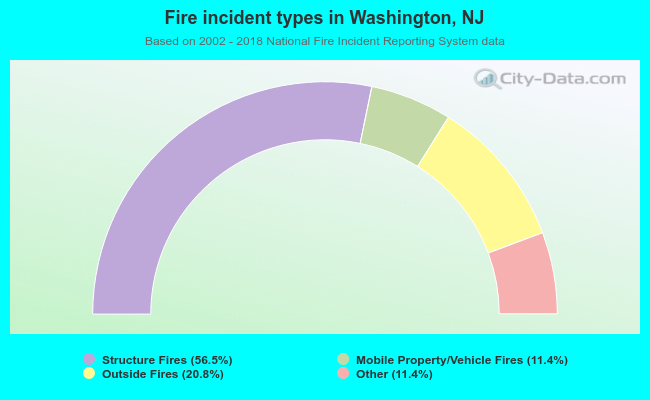 When looking into fire subcategories, the most incidents belonged to: Structure Fires (56.5%), and Outside Fires (20.8%).