Coconut Creek: Fire Incidents, Florida (FL)
Where are fire incidents reported in Coconut Creek, FL
Something went wrong! Please refresh the page.
| Fire incidents reported | |
|---|---|
| Sreet name | Count |
| LYONS RD | 298 |
| HILLSBORO BLVD | 152 |
| SR 7 | 146 |
| 39TH AVE | 132 |
| ATLANTIC BLVD | 106 |
| SAMPLE RD | 104 |
| WILES RD | 82 |
| COCONUT CREEK PKY | 66 |
| COCOPLUM CIR | 62 |
| 40TH ST | 54 |
| CARAMBOLA CIR | 44 |
| COPANS RD | 40 |
| 74TH PL | 38 |
| SUNSHINE DR | 36 |
| 49TH AVE | 32 |
| CORAL TREE CIR | 32 |
| 42ND AVE | 30 |
| COCONUT CREEK BLVD | 30 |
| 44TH AVE | 28 |
| FISHERMANS DR | 28 |
| LIGHTHOUSE CIR | 28 |
| SOL PRESS BLVD | 28 |
| 22ND ST | 26 |
| 55TH BLVD | 26 |
| 45TH AVE | 24 |
| 61ST ST | 24 |
| SR 7 RD | 24 |
| 47TH AVE | 22 |
| REGENCY LAKES BLVD | 22 |
| 41ST TER | 20 |
2002 - 2018 National Fire Incident Reporting System (NFIRS) incidents
- Incident types reported to NFIRS in Coconut Creek, FL
- 27,03359.1%Rescue & EMS
- 8,71719.1%Service Call
- 5,11411.2%Good Intent Call
- 2,3155.1%False Alarm
- 1,5003.3%Fire
- 9812.1%Hazardous Condition
- Fire incident types reported to NFIRS in Coconut Creek, FL
- 61040.7%Structure Fires
- 54036.0%Outside Fires
- 27118.1%Mobile Property/Vehicle Fires
- 795.3%Other
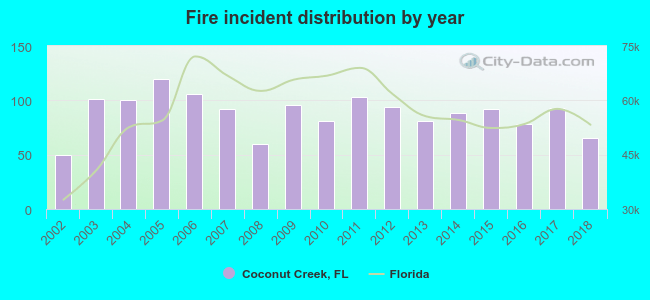 Based on the data from the years 2002 - 2018 the average number of fire incidents per year is 88. The highest number of reported fires - 120 took place in 2005, and the least - 50 in 2002. The data has a growing trend.
The average number of yearly fire incidents per 10k residents in Coconut Creek, FL compared to nearest cities:
(Note: Based on data for the last 3 years, including only cities with population 5,000 and above)
| Coconut Creek: | 13.4 |
| Margate: | 17.2 |
| Parkland: | 4.4 |
| Deerfield Beach: | 20.3 |
| Pompano Beach: | 20.2 |
| Coral Springs: | 3.5 |
| North Lauderdale: | 19.9 |
| Lighthouse Point: | 22.5 |
| Tamarac: | 11.5 |
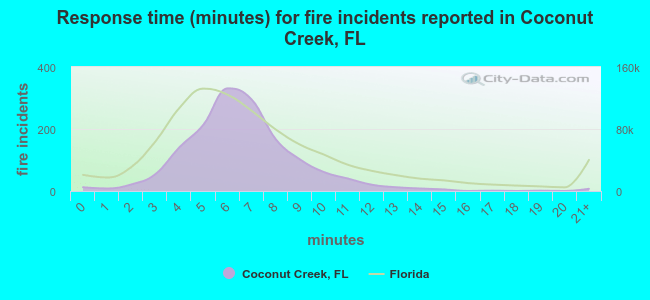 The median response time based on all reported fire incidents is 6 minutes. This is about the same as the Florida median value.
The median response time in Coconut Creek, FL compared to nearest cities:
(Note: Based on data for all years, including only cities with at least 500 fire incidents)
| Coconut Creek: | 6 minutes |
| Margate: | 5 minutes |
| Deerfield Beach: | 6 minutes |
| Pompano Beach: | 6 minutes |
| Coral Springs: | 5 minutes |
| North Lauderdale: | 5 minutes |
| Tamarac: | 6 minutes |
| Oakland Park: | 5 minutes |
| Lauderdale Lakes: | 6 minutes |
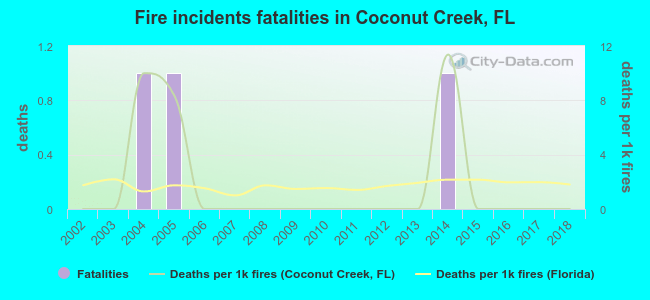 Based on the data from the years 2002 - 2018 the average number of fire-related yearly deaths is 0. The highest number of reported deaths - 1 took place in 2004, and the lowest - 0 in 2002. The data has a constant trend.
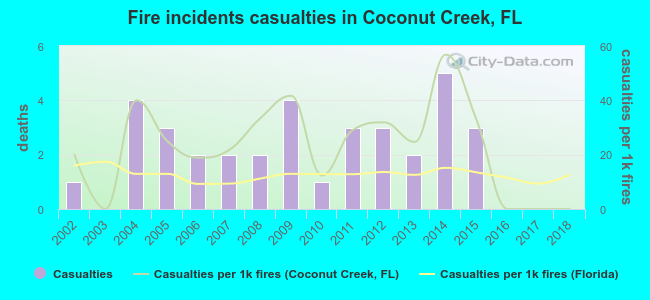 Based on the data from the years 2002 - 2018 the average number of fire-related yearly casualties is 2. The highest number of injuries - 5 took place in 2014, and the lowest - 0 in 2003. The data has a dropping trend.
The average number of casualties per 1,000 fires is 23. This indicator was the highest - 57 in 2014, and the lowest 0 in 2003. The trend for injuries per 1,000 fire incidents is dropping. Compared to the state value the number of casualties per 1,000 fires is higher.
Based on the data from the years 2002 - 2018 the average number of fire-related yearly casualties is 2. The highest number of injuries - 5 took place in 2014, and the lowest - 0 in 2003. The data has a dropping trend.
The average number of casualties per 1,000 fires is 23. This indicator was the highest - 57 in 2014, and the lowest 0 in 2003. The trend for injuries per 1,000 fire incidents is dropping. Compared to the state value the number of casualties per 1,000 fires is higher.Casualties per 1,000 incidents in Coconut Creek, FL compared to nearest cities:
(Note: Based on data for all years, including only cities with at least 500 fire incidents)
| Coconut Creek: | 23.3 |
| Margate: | 25.8 |
| Deerfield Beach: | 21.5 |
| Pompano Beach: | 41.3 |
| Coral Springs: | 16.9 |
| North Lauderdale: | 7.7 |
| Tamarac: | 7.1 |
| Oakland Park: | 0.5 |
| Lauderdale Lakes: | 31.3 |
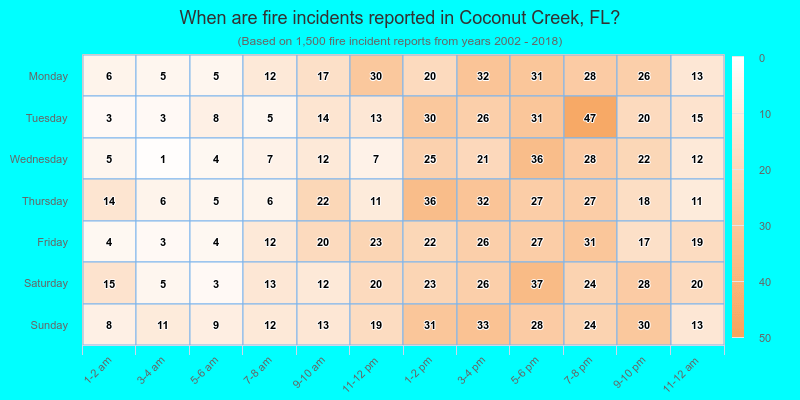
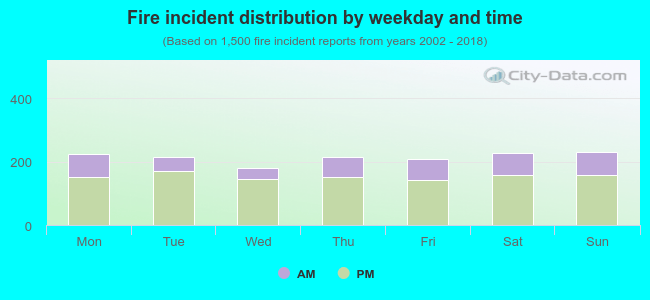 28.5% incidents where reported in the morning and 71.5% in the evening. The most fires (15.4%) took place on Sunday, and the least (12.0%) on Wednesday.
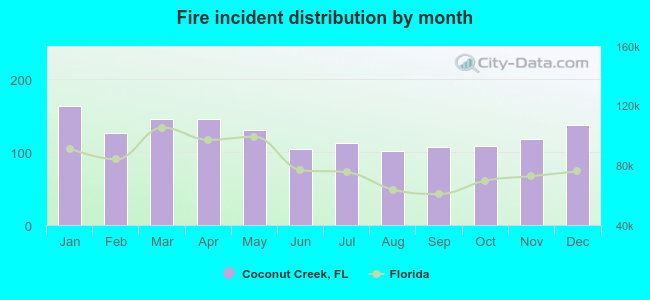 Based on the 1,500 fire incident reports from years 2002 - 2018 most fires (10.9%) took place during January, and the least (6.8%) in August.
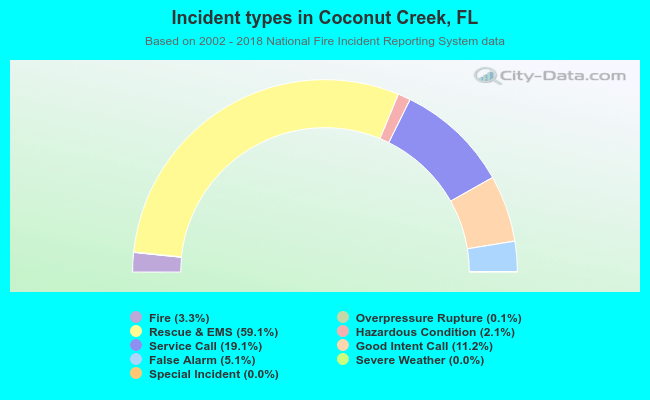 Out of all 45,720 cases reported during the years 2002 - 2018, the most belonged to the categories: Rescue & EMS (59.1%), Service Call (19.1%), and Good Intent Call (11.2%).
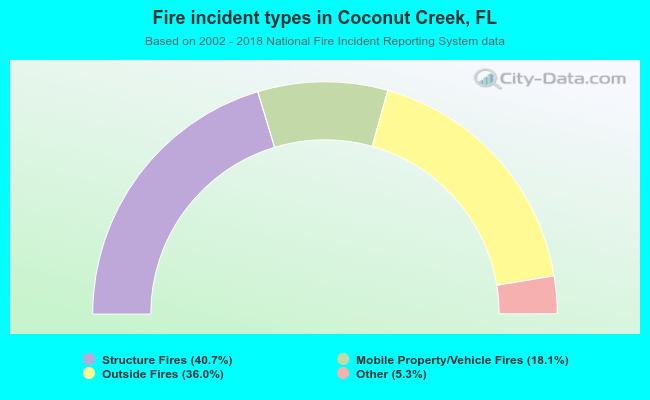 When looking into fire subcategories, the most incidents belonged to: Structure Fires (40.7%), and Outside Fires (36.0%).