Coral Springs: Fire Incidents, Florida (FL)
Where are fire incidents reported in Coral Springs, FL
Something went wrong! Please refresh the page.
| Fire incidents reported | |
|---|---|
| Sreet name | Count |
| UNIVERSITY DR | 370 |
| RIVERSIDE DR | 264 |
| SAMPLE RD | 262 |
| ATLANTIC BLVD | 254 |
| CORAL RIDGE DR | 232 |
| ROYAL PALM BLVD | 202 |
| WILES RD | 198 |
| SAWGRASS EXPY | 152 |
| SAMPLE | 128 |
| CORAL SPRINGS DR | 126 |
| WILES | 118 |
| 91ST AVE | 84 |
| RAMBLEWOOD DR | 82 |
| 99TH AVE | 76 |
| 35TH ST | 62 |
| SAWGRASS | 54 |
| STATE ROAD 7 | 52 |
| WESTVIEW DR | 52 |
| 40TH ST | 48 |
| TWIN LAKES DR | 48 |
| WOODSIDE DR | 42 |
| 87TH AVE | 40 |
| FOREST HILLS BLVD | 40 |
| UNIVERSITY | 36 |
| 124TH AVE | 34 |
| 1ST ST | 34 |
| 39TH ST | 34 |
| 88TH AVE | 34 |
| RIVERSIDE | 34 |
| 45TH ST | 32 |
2002 - 2016 National Fire Incident Reporting System (NFIRS) incidents
- Incident types reported to NFIRS in Coral Springs, FL
- 22,78361.2%Rescue & EMS
- 3,90710.5%Hazardous Condition
- 3,1338.4%Fire
- 2,6687.2%False Alarm
- 2,3366.3%Good Intent Call
- 2,3086.2%Service Call
- 420.1%Overpressure Rupture
- 380.1%Special Incident
- Fire incident types reported to NFIRS in Coral Springs, FL
- 1,35643.3%Outside Fires
- 1,10235.2%Structure Fires
- 51616.5%Mobile Property/Vehicle Fires
- 1595.1%Other
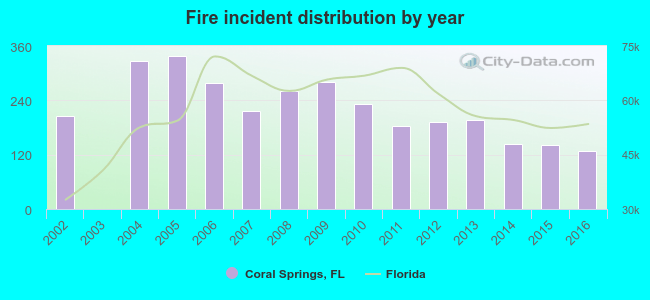 Based on the data from the years 2002 - 2016 the average number of fire incidents per year is 209. The highest number of fires - 338 took place in 2005, and the least - 1 in 2003. The data has a dropping trend.
The average number of yearly fire incidents per 10k residents in Coral Springs, FL compared to nearest cities:
(Note: Based on data for the last 3 years, including only cities with population 5,000 and above)
| Coral Springs: | 3.5 |
| Parkland: | 4.4 |
| Margate: | 17.2 |
| North Lauderdale: | 19.9 |
| Coconut Creek: | 13.4 |
| Tamarac: | 11.5 |
| Lauderhill: | 24.5 |
| Lauderdale Lakes: | 22.5 |
| Sunrise: | 16.0 |
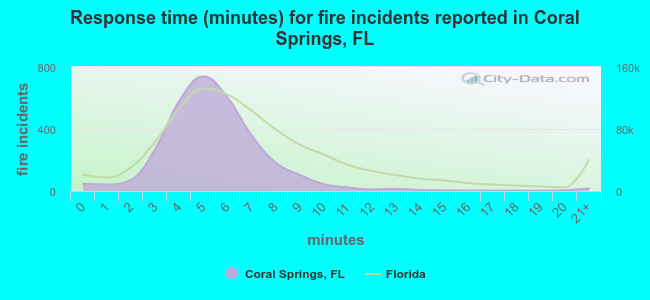 The median response time based on all reported fire incidents is 5 minutes. This is lower than the state median value.
The median response time in Coral Springs, FL compared to nearest cities:
(Note: Based on data for all years, including only cities with at least 500 fire incidents)
| Coral Springs: | 5 minutes |
| Margate: | 5 minutes |
| North Lauderdale: | 5 minutes |
| Coconut Creek: | 6 minutes |
| Tamarac: | 6 minutes |
| Lauderhill: | 6 minutes |
| Lauderdale Lakes: | 6 minutes |
| Sunrise: | 6 minutes |
| Pompano Beach: | 6 minutes |
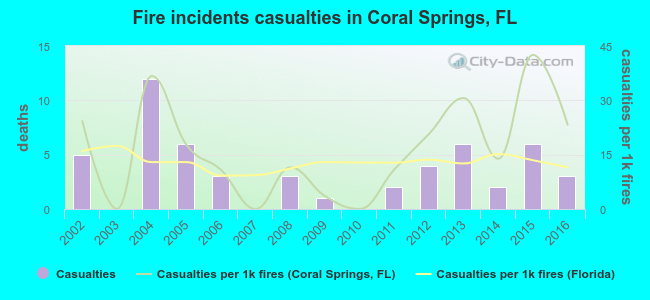 According to the data from the years 2002 - 2016 the average number of fire-related casualties per year is 4. The highest number of reported injuries - 12 took place in 2004, and the lowest - 0 in 2003. The data has a dropping trend.
The average number of casualties per 1,000 fires is 16. This indicator was the highest - 43 in 2015, and the lowest 0 in 2003. The trend for injuries per 1,000 fires is dropping. Compared to the Florida value the number of injuries per 1,000 fire incidents is higher.
According to the data from the years 2002 - 2016 the average number of fire-related casualties per year is 4. The highest number of reported injuries - 12 took place in 2004, and the lowest - 0 in 2003. The data has a dropping trend.
The average number of casualties per 1,000 fires is 16. This indicator was the highest - 43 in 2015, and the lowest 0 in 2003. The trend for injuries per 1,000 fires is dropping. Compared to the Florida value the number of injuries per 1,000 fire incidents is higher.Casualties per 1,000 incidents in Coral Springs, FL compared to nearest cities:
(Note: Based on data for all years, including only cities with at least 500 fire incidents)
| Coral Springs: | 16.9 |
| Margate: | 25.8 |
| North Lauderdale: | 7.7 |
| Coconut Creek: | 23.3 |
| Tamarac: | 7.1 |
| Lauderhill: | 39.2 |
| Lauderdale Lakes: | 31.3 |
| Sunrise: | 32.6 |
| Pompano Beach: | 41.3 |
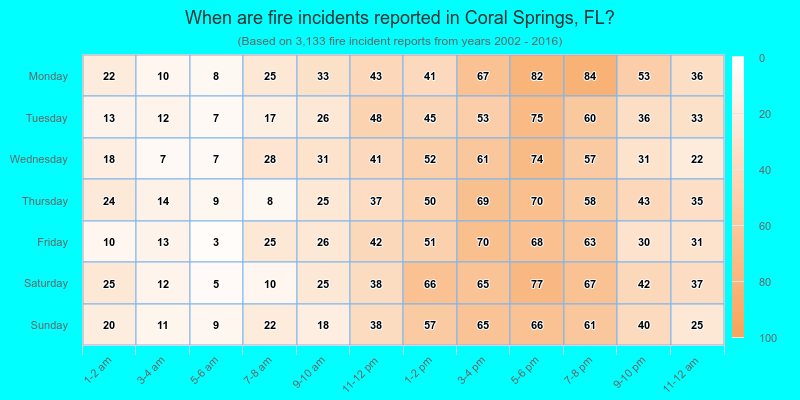
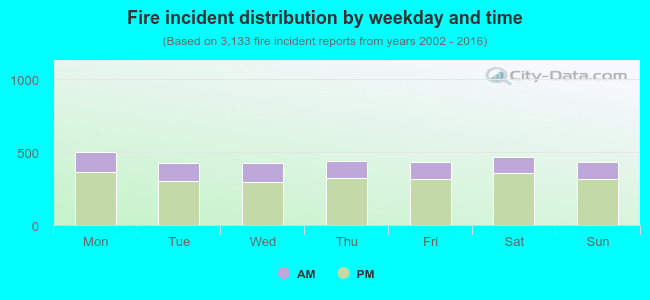 27.6% incidents where reported in the morning and 72.4% in the evening. The most fires (16.1%) took place on Monday, and the least (13.6%) on Tuesday.
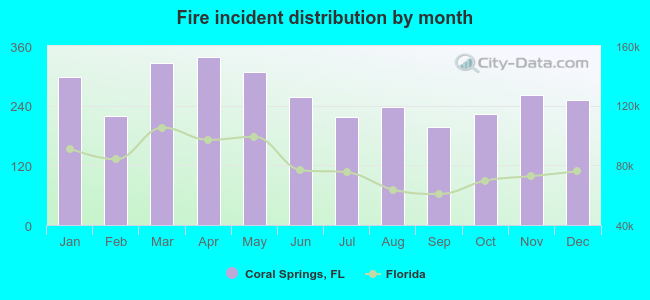 Based on the 3,133 reports from years 2002 - 2016 most fires (10.8%) took place during April, and the least (6.3%) in September.
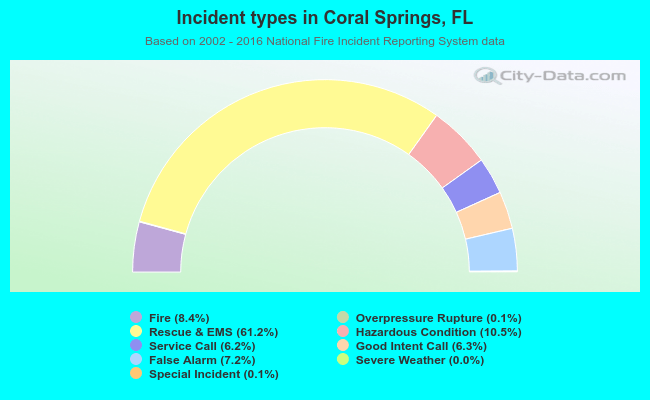 Out of all 37,224 cases reported during the years 2002 - 2016, the most belonged to the categories: Rescue & EMS (61.2%), Hazardous Condition (10.5%), and Fire (8.4%).
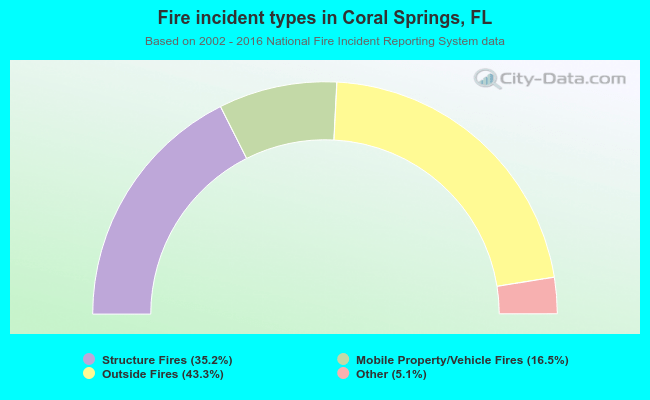 When looking into fire subcategories, the most incidents belonged to: Outside Fires (43.3%), and Structure Fires (35.2%).