College Park: Fire Incidents, Georgia (GA)
Where are fire incidents reported in College Park, GA
Something went wrong! Please refresh the page.
| Fire incidents reported | |
|---|---|
| Sreet name | Count |
| OLD NATIONAL HWY | 346 |
| GODBY RD | 328 |
| RIVERDALE RD | 268 |
| ROOSEVELT HWY | 184 |
| SULLIVAN RD | 120 |
| FLAT SHOALS RD | 116 |
| I285 | 108 |
| LAKEMONT DR | 100 |
| GARDEN WALK BLVD | 88 |
| WASHINGTON RD | 84 |
| HERSCHEL RD | 80 |
| CHARLESTOWN DR | 74 |
| I85 | 74 |
| CAMELOT DR | 68 |
| BUFFINGTON RD | 66 |
| 285 INTS | 62 |
| CAMP CREEK PKWY | 60 |
| SOUTHAMPTON RD | 52 |
| MAIN ST | 50 |
| OLD BILL COOK RD | 50 |
| VIRGINIA AVE | 48 |
| STONEWALL TELL RD | 46 |
| WELCOME ALL RD | 46 |
| BUTNER RD | 44 |
| CAMP CREEK | 42 |
| DELANO RD | 42 |
| I 85 | 38 |
| EAST MAIN ST | 36 |
| CREEL RD | 32 |
| I-85 | 32 |
| Other | 914 |
2004 - 2018 National Fire Incident Reporting System (NFIRS) incidents
- Incident types reported to NFIRS in College Park, GA
- 27,58765.2%Rescue & EMS
- 3,6988.7%Fire
- 3,2487.7%Service Call
- 2,8586.8%Good Intent Call
- 2,5686.1%Hazardous Condition
- 2,2165.2%False Alarm
- 560.1%Severe Weather
- 450.1%Special Incident
- Fire incident types reported to NFIRS in College Park, GA
- 1,50540.7%Outside Fires
- 1,22833.2%Structure Fires
- 83822.7%Mobile Property/Vehicle Fires
- 1273.4%Other
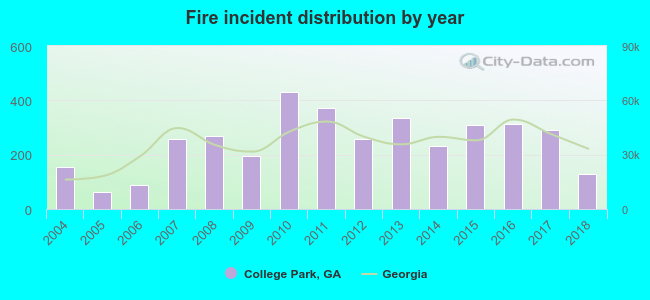 According to the data from the years 2004 - 2018 the average number of fires per year is 247. The highest number of reported fire incidents - 431 took place in 2010, and the least - 62 in 2005. The data has a decreasing trend.
The average number of yearly fire incidents per 10k residents in College Park, GA compared to nearest cities:
(Note: Based on data for the last 3 years, including only cities with population 5,000 and above)
| College Park: | 167.6 |
| East Point: | 37.5 |
| Hapeville: | 43.0 |
| Forest Park: | 76.9 |
| Riverdale: | 147.4 |
| Conley: | 53.0 |
| Union City: | 69.7 |
| Morrow: | 142.3 |
| Atlanta: | 36.1 |
 The median response time based on all reported fire incidents is 6 minutes. This is about the same as the Georgia median value.
The median response time in College Park, GA compared to nearest cities:
(Note: Based on data for all years, including only cities with at least 500 fire incidents)
| College Park: | 6 minutes |
| East Point: | 6 minutes |
| Hapeville: | 3 minutes |
| Forest Park: | 6 minutes |
| Riverdale: | 5 minutes |
| Union City: | 5 minutes |
| Morrow: | 5 minutes |
| Atlanta: | 5 minutes |
| Fairburn: | 6 minutes |
 According to the data from the years 2004 - 2018 the average number of fire-related fatalities per year is 0. The highest number of deaths - 3 took place in 2011, and the lowest - 0 in 2004. The data has a constant trend.
The average number of deaths per 1,000 fires is 2. This indicator was the highest - 8 in 2011, and the lowest 0 in 2004. The trend for deaths per 1,000 fire incidents is constant. Compared to the Georgia value the number of deaths per 1,000 fires is about the same.
According to the data from the years 2004 - 2018 the average number of fire-related fatalities per year is 0. The highest number of deaths - 3 took place in 2011, and the lowest - 0 in 2004. The data has a constant trend.
The average number of deaths per 1,000 fires is 2. This indicator was the highest - 8 in 2011, and the lowest 0 in 2004. The trend for deaths per 1,000 fire incidents is constant. Compared to the Georgia value the number of deaths per 1,000 fires is about the same.Deaths per 1,000 incidents in College Park, GA compared to nearest cities:
(Note: Based on data for all years, including only cities with at least 2,500 fire incidents)
| College Park: | 1.9 |
| Riverdale: | 1.0 |
| Atlanta: | 3.1 |
| Jonesboro: | 1.1 |
| Decatur: | 2.1 |
| Fayetteville: | 1.7 |
| Stockbridge: | 2.3 |
| Austell: | 1.1 |
| Smyrna: | 4.7 |
 According to the data from the years 2004 - 2018 the average number of fire-related yearly casualties is 1. The highest number of reported casualties - 5 took place in 2004, and the lowest - 0 in 2006. The data has a decreasing trend.
The average number of injuries per 1,000 fire incidents is 6. This indicator was the highest - 32 in 2004, and the lowest 0 in 2006. The trend for injuries per 1,000 incidents is decreasing. Compared to the state value the number of casualties per 1,000 fire incidents is lower.
According to the data from the years 2004 - 2018 the average number of fire-related yearly casualties is 1. The highest number of reported casualties - 5 took place in 2004, and the lowest - 0 in 2006. The data has a decreasing trend.
The average number of injuries per 1,000 fire incidents is 6. This indicator was the highest - 32 in 2004, and the lowest 0 in 2006. The trend for injuries per 1,000 incidents is decreasing. Compared to the state value the number of casualties per 1,000 fire incidents is lower.Casualties per 1,000 incidents in College Park, GA compared to nearest cities:
(Note: Based on data for all years, including only cities with at least 500 fire incidents)
| College Park: | 4.6 |
| East Point: | 9.2 |
| Hapeville: | 0.0 |
| Forest Park: | 36.9 |
| Riverdale: | 10.6 |
| Union City: | 4.5 |
| Morrow: | 13.0 |
| Atlanta: | 6.7 |
| Fairburn: | 7.5 |
 29.2% incidents where reported in the morning and 70.8% in the evening. The most fires (16.4%) took place on Sunday, and the least (13.3%) on Thursday.
 According to the 3,698 fires from years 2004 - 2018 most fires (12.1%) took place during March, and the least (6.4%) in September.
 Out of all 42,304 cases reported during the years 2004 - 2018, the most belonged to the categories: Rescue & EMS (65.2%), Fire (8.7%), and Service Call (7.7%).
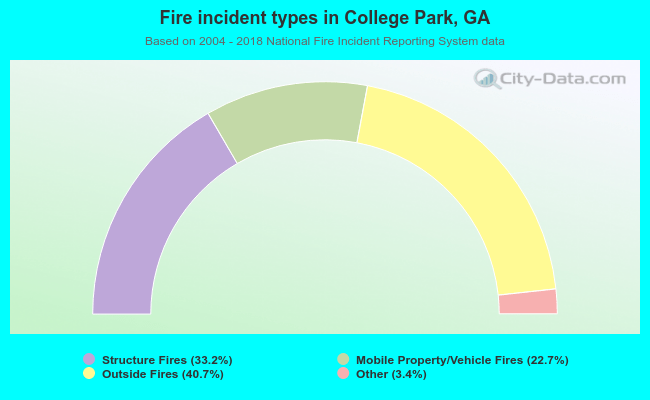 When looking into fire subcategories, the most incidents belonged to: Outside Fires (40.7%), and Structure Fires (33.2%).