Hapeville: Fire Incidents, Georgia (GA)
Where are fire incidents reported in Hapeville, GA
Something went wrong! Please refresh the page.
|
| |||||||||||||||||||||||||||||||||||||||||||||||||||||||||||||||||||||||||||||||||||||||||||||||||||||||||||||
2002 - 2018 National Fire Incident Reporting System (NFIRS) incidents
- Incident types reported to NFIRS in Hapeville, GA
- 4,84871.1%Rescue & EMS
- 5167.6%Fire
- 5067.4%Hazardous Condition
- 3445.0%False Alarm
- 2904.3%Service Call
- 2353.4%Good Intent Call
- 470.7%Severe Weather
- 170.2%Special Incident
- 160.2%Overpressure Rupture
- Fire incident types reported to NFIRS in Hapeville, GA
- 19036.8%Outside Fires
- 17433.7%Structure Fires
- 10620.5%Mobile Property/Vehicle Fires
- 468.9%Other
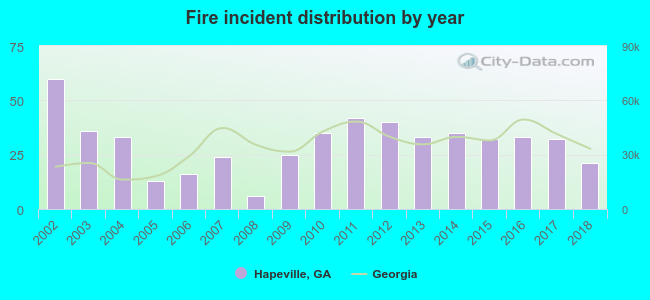 Based on the data from the years 2002 - 2018 the average number of fire incidents per year is 30. The highest number of fires - 60 took place in 2002, and the least - 6 in 2008. The data has a declining trend.
The average number of yearly fire incidents per 10k residents in Hapeville, GA compared to nearest cities:
(Note: Based on data for the last 3 years, including only cities with population 5,000 and above)
| Hapeville: | 43.0 |
| East Point: | 37.5 |
| College Park: | 167.6 |
| Forest Park: | 76.9 |
| Conley: | 53.0 |
| Gresham Park: | 5.4 |
| Atlanta: | 36.1 |
| Riverdale: | 147.4 |
| Morrow: | 142.3 |
 The median response time based on all reported fire incidents is 3 minutes. This is much lower than the state median value.
The median response time in Hapeville, GA compared to nearest cities:
(Note: Based on data for all years, including only cities with at least 500 fire incidents)
| Hapeville: | 3 minutes |
| East Point: | 6 minutes |
| College Park: | 6 minutes |
| Forest Park: | 6 minutes |
| Atlanta: | 5 minutes |
| Riverdale: | 5 minutes |
| Morrow: | 5 minutes |
| Union City: | 5 minutes |
| Decatur: | 5 minutes |
 29.8% incidents where reported in the morning and 70.2% in the evening. The most fires (17.4%) took place on Saturday, and the least (12.6%) on Friday.
 Based on the 516 fires from years 2002 - 2018 most fires (11.4%) took place during August, and the least (4.1%) in October.
 Out of all 6,819 cases reported during the years 2002 - 2018, the most belonged to the categories: Rescue & EMS (71.1%), Fire (7.6%), and Hazardous Condition (7.4%).
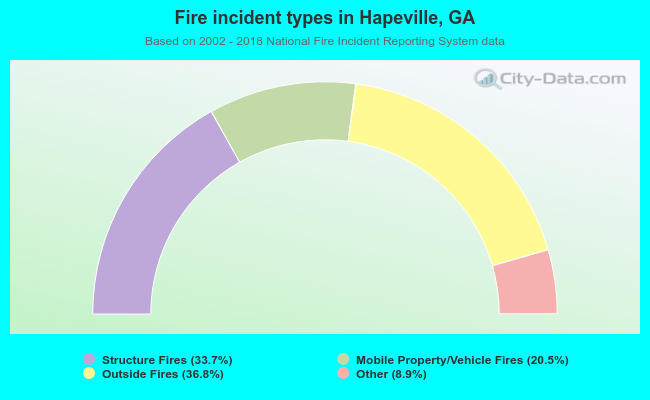 When looking into fire subcategories, the most reports belonged to: Outside Fires (36.8%), and Structure Fires (33.7%).