Colorado City: Fire Incidents, Texas (TX)
Where are fire incidents reported in Colorado City, TX
Something went wrong! Please refresh the page.
|
| |||||||||||||||||||||||||||||||||||||||||||||||||||||||||||||||||||||||||||||||||||||||||||||||||||||||||||||
| Other | 85 | |||||||||||||||||||||||||||||||||||||||||||||||||||||||||||||||||||||||||||||||||||||||||||||||||||||||||||||
2004 - 2017 National Fire Incident Reporting System (NFIRS) incidents
- Incident types reported to NFIRS in Colorado City, TX
- 82961.1%Fire
- 22416.5%Hazardous Condition
- 14310.5%Good Intent Call
- 1319.7%Service Call
- 191.4%False Alarm
- 100.7%Rescue & EMS
- Fire incident types reported to NFIRS in Colorado City, TX
- 54766.0%Outside Fires
- 15718.9%Structure Fires
- 9211.1%Mobile Property/Vehicle Fires
- 334.0%Other
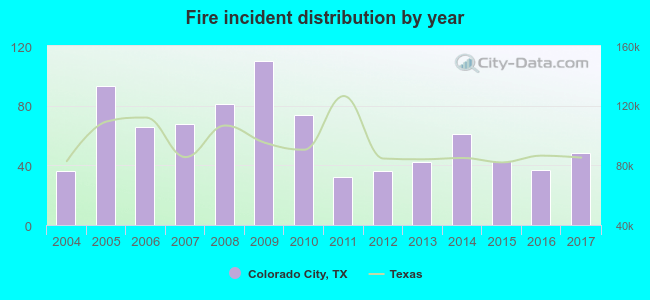 Based on the data from the years 2004 - 2017 the average number of fires per year is 59. The highest number of reported fire incidents - 110 took place in 2009, and the least - 32 in 2011. The data has an increasing trend.
 The median response time based on all reported fire incidents is 6 minutes. This is close to the Texas median value.
The median response time in Colorado City, TX compared to nearest cities:
(Note: Based on data for all years, including only cities with at least 500 fire incidents)
| Colorado City: | 6 minutes |
| Snyder: | 9 minutes |
| Sweetwater: | 4 minutes |
| Big Spring: | 7 minutes |
| Abilene: | 5 minutes |
| Lamesa: | 6 minutes |
| San Angelo: | 6 minutes |
| Ballinger: | 8 minutes |
| Stamford: | 9 minutes |
 Based on the data from the years 2004 - 2017 the average number of fire-related yearly deaths is 0. The highest number of deaths - 3 took place in 2006, and the lowest - 0 in 2005. The data has a dropping trend.
 25.5% incidents where reported in the morning and 74.5% in the evening. The most fires (16.0%) took place on Saturday, and the least (12.9%) on Thursday.
 According to the 829 fire incidents from years 2004 - 2017 most fires (11.3%) took place during July, and the least (5.3%) in October.
 Out of all 1,357 cases reported during the years 2004 - 2017, the most belonged to the categories: Fire (61.1%), Rescue & EMS (16.5%), and Service Call (10.5%).
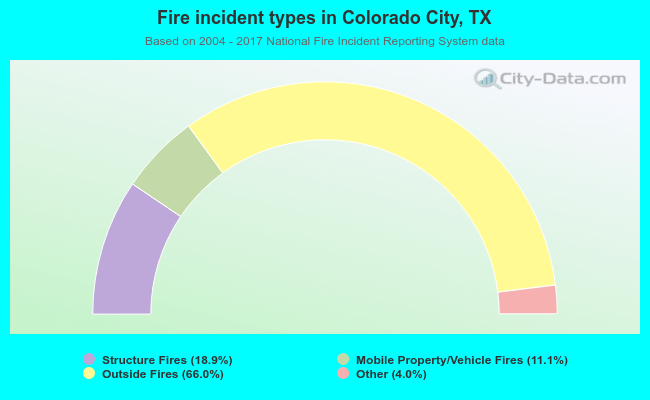 When looking into fire subcategories, the most reports belonged to: Outside Fires (66.0%), and Structure Fires (18.9%).