Sweetwater: Fire Incidents, Texas (TX)
Where are fire incidents reported in Sweetwater, TX
Something went wrong! Please refresh the page.
| Fire incidents reported | |
|---|---|
| Sreet name | Count |
| INTERSTATE 20 | 194 |
| BROADWAY | 84 |
| HWY 70 | 76 |
| I20 | 40 |
| LAMAR | 38 |
| GEORGIA | 36 |
| BOWIE | 32 |
| BRADFORD LN | 32 |
| ALABAMA | 30 |
| ARKANSAS | 28 |
| CR 109 | 28 |
| FM 419 | 28 |
| HAILEY | 28 |
| I-20 | 28 |
| LOUISIANA | 28 |
| INTERSTATE HIGHWAY 20 | 26 |
| NEW MEXICO | 26 |
| I H 20 | 24 |
| PEASE | 24 |
| ARIZONA | 22 |
| FM 2035 | 22 |
| POPLAR | 22 |
| AVE A | 20 |
| CR 147 | 20 |
| ELM | 20 |
| F.M. 419 | 20 |
| HILL | 20 |
| JAMES | 20 |
| JOSEPHINE | 20 |
| OKLAHOMA | 20 |
| Other | 524 |
2005 - 2018 National Fire Incident Reporting System (NFIRS) incidents
- Incident types reported to NFIRS in Sweetwater, TX
- 1,58036.8%Fire
- 1,07325.0%Rescue & EMS
- 66915.6%Hazardous Condition
- 47211.0%Service Call
- 3037.1%Good Intent Call
- 1643.8%False Alarm
- 180.4%Special Incident
- 120.3%Overpressure Rupture
- Fire incident types reported to NFIRS in Sweetwater, TX
- 91457.8%Outside Fires
- 38524.4%Structure Fires
- 22314.1%Mobile Property/Vehicle Fires
- 583.7%Other
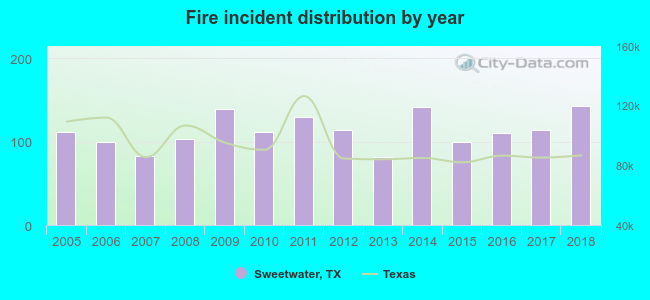 According to the data from the years 2005 - 2018 the average number of fire incidents per year is 113. The highest number of reported fire incidents - 143 took place in 2018, and the least - 81 in 2013. The data has a rising trend.
The average number of yearly fire incidents per 10k residents in Sweetwater, TX compared to nearest cities:
(Note: Based on data for the last 3 years, including only cities with population 5,000 and above)
| Sweetwater: | 113.2 |
| Snyder: | 47.5 |
| Abilene: | 41.0 |
| Big Spring: | 67.3 |
| San Angelo: | 20.7 |
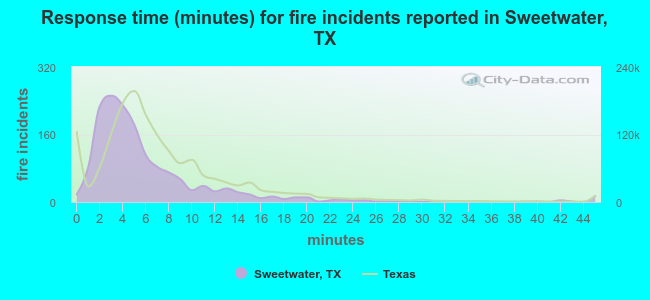 The median response time based on all reported fire incidents is 4 minutes. This is lower than the Texas median value.
The median response time in Sweetwater, TX compared to nearest cities:
(Note: Based on data for all years, including only cities with at least 500 fire incidents)
| Sweetwater: | 4 minutes |
| Colorado City: | 6 minutes |
| Snyder: | 9 minutes |
| Abilene: | 5 minutes |
| Stamford: | 9 minutes |
| Clyde: | 12 minutes |
| Ballinger: | 8 minutes |
| Baird: | 15 minutes |
| Big Spring: | 7 minutes |
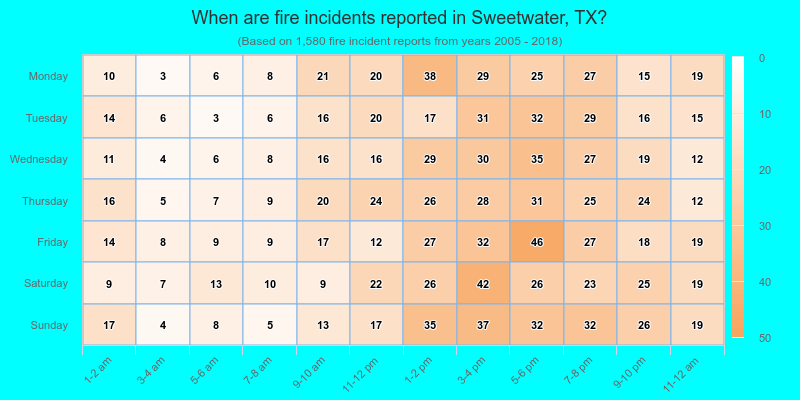
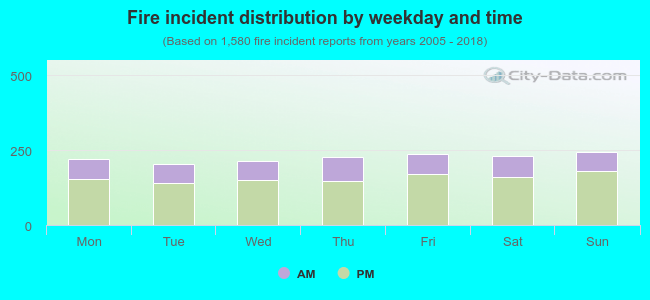 30.3% incidents where reported in the morning and 69.7% in the evening. The most fires (15.5%) took place on Sunday, and the least (13.0%) on Tuesday.
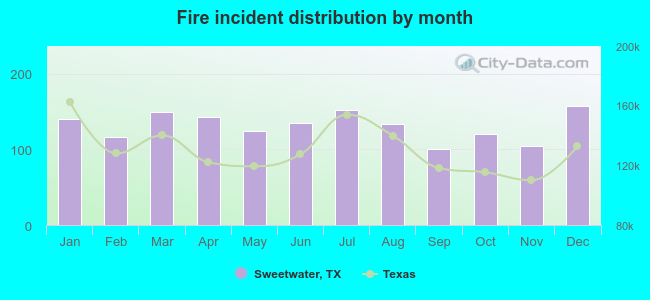 According to the 1,580 incident reports from years 2005 - 2018 most fires (10.0%) took place during December, and the least (6.4%) in September.
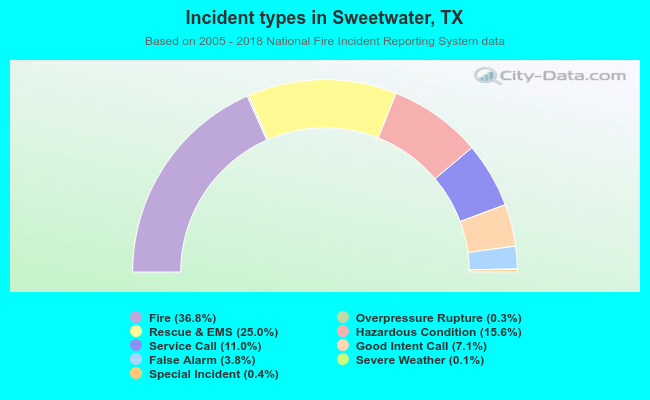 Out of all 4,294 cases reported during the years 2005 - 2018, the most belonged to the categories: Fire (36.8%), Rescue & EMS (25.0%), and Hazardous Condition (15.6%).
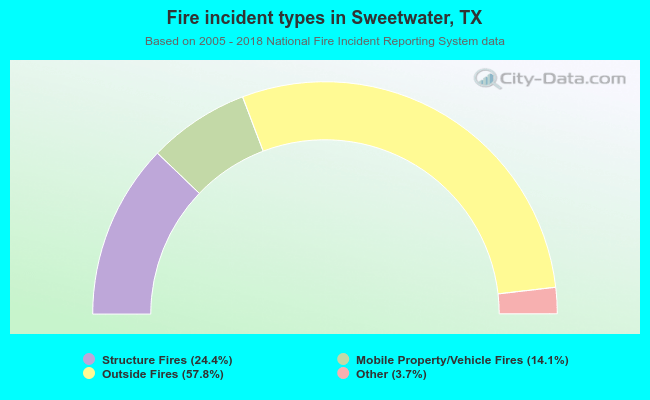 When looking into fire subcategories, the most incidents belonged to: Outside Fires (57.8%), and Structure Fires (24.4%).