Colton: Fire Incidents, Oregon (OR)
Where are fire incidents reported in Colton, OR
Something went wrong! Please refresh the page.
|
| |||||||||||||||||||||||||||||||||||||||||||||||||||||||||||||||||||||||||||||||||||||||||||||||||||||||||||||
2003 - 2018 National Fire Incident Reporting System (NFIRS) incidents
- Incident types reported to NFIRS in Colton, OR
- 83847.6%Rescue & EMS
- 25714.6%Fire
- 22712.9%Good Intent Call
- 21112.0%Service Call
- 1679.5%Hazardous Condition
- 402.3%False Alarm
- 130.7%Severe Weather
- 40.2%Special Incident
- 30.2%Overpressure Rupture
- Fire incident types reported to NFIRS in Colton, OR
- 14255.3%Structure Fires
- 6726.1%Outside Fires
- 3112.1%Mobile Property/Vehicle Fires
- 176.6%Other
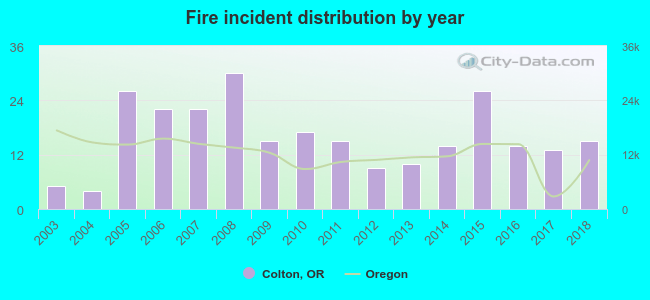 According to the data from the years 2003 - 2018 the average number of fires per year is 16. The highest number of fire incidents - 30 took place in 2008, and the least - 4 in 2004. The data has a growing trend.
The average number of yearly fire incidents per 10k residents in Colton, OR compared to nearest cities:
(Note: Based on data for the last 3 years, including only cities with population 5,000 and above)
| Colton: | 25.2 |
| Mulino: | 17.3 |
| Molalla: | 52.6 |
| Beaver Creek: | 6.4 |
| Canby: | 30.4 |
| Oregon City: | 20.3 |
| Sandy: | 30.7 |
| Gladstone: | 27.8 |
| Damascus: | 13.8 |

 32.7% incidents where reported in the morning and 67.3% in the evening. The most fires (20.2%) took place on Sunday, and the least (10.1%) on Saturday.
 According to the 257 fire incidents from years 2003 - 2018 most fires (10.9%) took place during May, and the least (5.8%) in July.
 Out of all 1,760 cases reported during the years 2003 - 2018, the most belonged to the categories: Rescue & EMS (47.6%), Fire (14.6%), and Good Intent Call (12.9%).
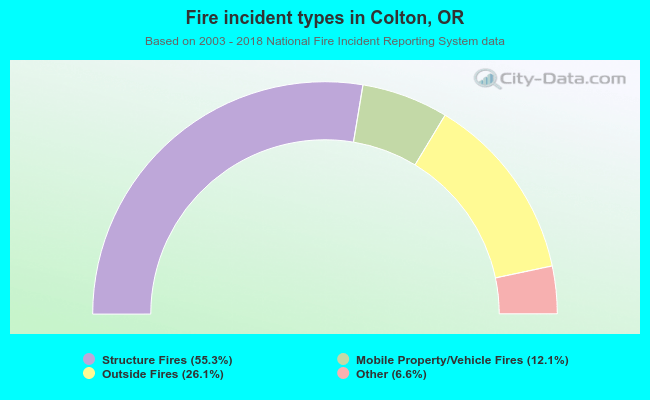 When looking into fire subcategories, the most incidents belonged to: Structure Fires (55.3%), and Outside Fires (26.1%).